Observable-conditioned ΔC theory for Poisson PSF-fitting source detection (v30.6)
Poisson source-detection pipelines report a likelihood-based
detection statistic for every candidate source — for example $\DETML$ in the XMM-Newton SAS — and use that
number for catalog thresholding and sensitivity-map construction. Near
the threshold, however, the relevant object is the sampling distribution
of the underlying Cash-statistic likelihood-ratio improvement
,
not merely the reported scalar statistic. We derive an
observable-conditioned theory for the conditional mean of
given the fitted source amplitude, the local background, the
position-dependent PSF and the detection mask in the standard
three-parameter single-source PSF fit, and use a Fisher projection to
approximate the high-signal variance. The pipeline statistic is treated
only as the final incomplete-gamma transform of
.
We validate the framework on the XMM-Newton PN band-4 standalone
emldetect chain. In self-consistent reference-fitter
simulations spanning 17 detector positions and
fits, the theoretical mean matches the simulated mean to within
0.07
in the high-signal regime, and the Fisher-projected variance reproduces
the simulated variance to within
.
In the operational threshold band ($\DETML=6$–10), the asymptotic theory carries
a known low-signal bias while the standalone emldetect adds
an implementation-dependent residual. We absorb both into an empirical,
position-dependent residual calibration, yielding a mean/median
threshold fitted-amplitude calibration at $\DETML=6$ with an 11% uncertainty for the
preferred 2D interpolation (17% for the nearest-calibration-position
fallback), and a validated weak background dependence over
–.
The resulting framework converts the $\DETML$ selection into a probabilistic
mapping between fitted amplitude and detection statistic. It can be used
backwards — to interpret traditional $\DETML$-selected catalogs together with a
source-count prior — and forwards — to construct fitted-amplitude
threshold-crossing cuts and percentile sensitivity maps; a production
selection function requires additional validation of the dispersion and
tail models.
Introduction
Source detection in Poisson-count photon imaging is usually done by
fitting a parameterized source model on a known background and
summarizing the result with a likelihood-ratio statistic. Under the
standard Cash statistic formulation (Cash
1979), the natural statistical object is the Cash improvement
,
where
is proportional to twice the negative Poisson log-likelihood. Detection
pipelines typically report a monotonic transform of
as the “detection likelihood”; for example, in the XMM-Newton Science
Analysis System (SAS), emldetect (Cruddace et al. 1988; Watson et al. 2009) fits a
three-parameter source model — one free amplitude and two free position
coordinates — to Poisson-count images and reports DET_ML,
the incomplete-gamma transform of the underlying
.
The reported detection-likelihood statistic is operationally important:
it is used to decide which sources enter the catalog, to define
detection thresholds and to build sensitivity maps.
Sensitivity maps and source-count methodology have been extensively
developed and applied in major X-ray surveys (Cappelluti et al.
2009; Georgakakis et al. 2008; Laird et al. 2009; Luo et al. 2017, e.g.,; Mateos et al. 2008; Puccetti et al. 2009;
Wang et al. 2016; Xue et al. 2011).
The statistical treatment of Poisson source detection, limits and
likelihood-ratio methods also has a long history in high-energy
astrophysics (Broos et al. 2010, e.g.,;
Gehrels 1986; Kashyap et al. 2010; Kraft et al. 1991; Protassov et al.
2002; Starck et al.
2002). The emldetect tool has been the standard
for XMM-Newton serendipitous survey catalogs (Carrera et al. 2007; Rosen et al. 2016; Traulsen et al. 2019;
Watson et al. 2009;
Webb et al.
2020).
We emphasize at the outset that the $\DETML$ used in this paper is strictly an operational monotonic threshold scale inherited from the SAS convention. We do not interpret it as a calibrated frequentist false-alarm probability. The standard null distribution that supports the incomplete-gamma transform assumes internal regularity conditions (Chernoff 1954; Protassov et al. 2002; Self & Liang 1987) that are violated at the parameter-space boundary () and when the position parameters are unidentifiable under the null hypothesis. The applicability of that null distribution is itself contested: Stewart (2009) argue from Monte Carlo experiments that, under typical X-ray instrument conditions, the Cash statistic null distribution is quite close to the corresponding provided candidates with negative fitted amplitude are discarded from the sample, and on that basis reject Protassov et al. (2002)’s claim that likelihood-ratio statistics are unsuitable for source detection. More generally, the distribution of the Cash statistic itself departs from its high-count limit under low-count Poisson conditions (Bonamente 2020). This paper does not enter that dispute: our use of the $\DETML$– conversion is purely operational: it maps the detection threshold chosen by the survey analyst to the corresponding value, where the observable-conditioned theory applies.
The practically relevant threshold regime is low signal. For many XMM-Newton applications, the relevant sensitivity-map range is $\DETML$ of order 6–10. This is the regime where source counts are steep, Poisson fluctuations matter, and small changes in the detection threshold can change the inferred limiting flux. It is therefore also the regime where Eddington bias becomes important: random upward fluctuations are preferentially selected near the detection boundary, so the selected sample no longer represents the untruncated parent distribution (Eddington 1913; Wang 2004).
The core challenge is not the absence of a predictable mean. The
expected
at the fitted source has long been computable analytically and has been
used in X-ray sensitivity-map construction as a single deterministic
value. The direct origin of this idea is Stewart (2006, 2009): in a systematic comparison of the
sensitivity of various source-detection methods under Poisson noise,
Stewart (2009) give a
closed-form approximation for
in the single-parameter case where only the amplitude is fitted — after
a sign conversion it is identical to the single-parameter limit of
Eq. ([eq:mu3p]) in this paper (plus an empirical
constant offset, to which we return in Section 4.5) — and
explicitly propose it for Cash-type source-detection sensitivity-map
construction. Inside SAS itself, from version 4.0 onward,
esensmap carries an emldetect-style analytic
Cash-statistic model, following the emldetect
form of the 3XMM and 4XMM catalog pipelines (Rosen et al. 2016; Traulsen et al. 2019); outside SAS, the
same expectation is evaluated at the detected (rather than
injected) source flux to construct sensitivity maps for the New-ANGELS
XMM legacy survey (Huang et al. 2025,
appendix).
These prior works leave a gap in two respects. First, the conditioning variable they use is the model (injected) source amplitude, not the fitted amplitude actually reported by the detection pipeline. Second, and more fundamentally: although Stewart (2009) explicitly discuss the probability density of the detection statistic and weigh the mean versus the median for defining sensitivity, X-ray sensitivity-map practice ultimately used only the mean of that distribution; the width and shape of the distribution were never analytically modeled, validated by instrument position, or calibrated for a specific detection pipeline. Correspondingly, we find no precedent for using the conditional dispersion of in catalog-level threshold-crossing calculations. At the level of the moments of , the closest work comes from spectral analysis rather than source detection: Kaastra (2017) give closed-form expressions for the expectation and variance of the C statistic under the null model, for goodness-of-fit testing.
It is, however, the distribution itself — not merely the mean — that controls the Eddington bias in the threshold regime and the precision of any downstream flux limit or source-count correction. We therefore work at the distribution level. Under standard regularity conditions, the conditional distribution of at the fitted source has a clean character — for a three-parameter single-source fit it is a non-central chi-square distribution with degrees of freedom, well approximated by a Gaussian in the high-signal limit — and both its mean and variance can be computed in closed form. This methodological lineage has been systematically developed in high-energy physics: based on the results of Wilks and Wald, Cowan et al. (2011) give the asymptotic distribution of the discovery test statistic under the signal hypothesis and introduce the Asimov data set as fluctuation-free reference data, thereby obtaining the expected sensitivity and its fluctuations analytically without Monte Carlo. The derivation in Section 3 of this paper is structurally an expansion of that framework to pixelized Poisson imaging: the Asimov mean gives the conditional expectation and the Fisher information gives the variance, the difference being that here one must explicitly handle the pixelized PSF, the fit mask, and the fluctuation directions absorbed by the free position parameters. The pipeline-reported detection-likelihood statistic, however, is a nonlinear incomplete-gamma transform of and is therefore not Gaussian; truncating the reported statistic near the threshold selectively truncates a non-Gaussian distribution, and that is precisely the regime where sensitivity maps and source-count corrections are most susceptible to Eddington bias.
In self-consistent reference-fitter simulations spanning 17 PN band-4
detector positions and including about
fits, the predicted conditional mean and Fisher-projected variance match
the simulation results to within 0.07
and about 5% respectively in the high-signal regime (Section 4). The
working threshold band lies at lower fitted signal, where the asymptotic
theory carries a residual low-signal bias and the standalone SAS
emldetect introduces an implementation-dependent residual
relative to the reference fit; both are absorbed into an empirical,
position-dependent residual calibration (Section 5). The resulting
sensitivity-limit equation (Section 6) reproduces the ground-truth
limiting amplitude at
to within 11% (preferred 2D interpolation) and 17% (nearest-neighbor
fallback), and shows a weak background dependence over the tested
background range
.
The observable-conditioning principle is set out in Section 2 and the
three-parameter
theory is derived in Section 3. Sections 4–6 cover reference-fitter
validation, standalone emldetect threshold calibration, and
the sensitivity-map recipe respectively. Section 7 lists the validated
and unvalidated domains of this result.
Observable-Conditioned Residuals
The central statistical object is the conditional expectation of in observable space,
where
is the fitted source amplitude,
is the local background in counts per pixel,
is the pixelized PSF template used by the fit model, and
is the image region included in the fit. Section 3 derives this
expectation analytically; Section 5 turns it into an operational
standalone emldetect threshold calibration, and Section 6
turns it into a sensitivity-map recipe. Figure 1 summarizes this logic.
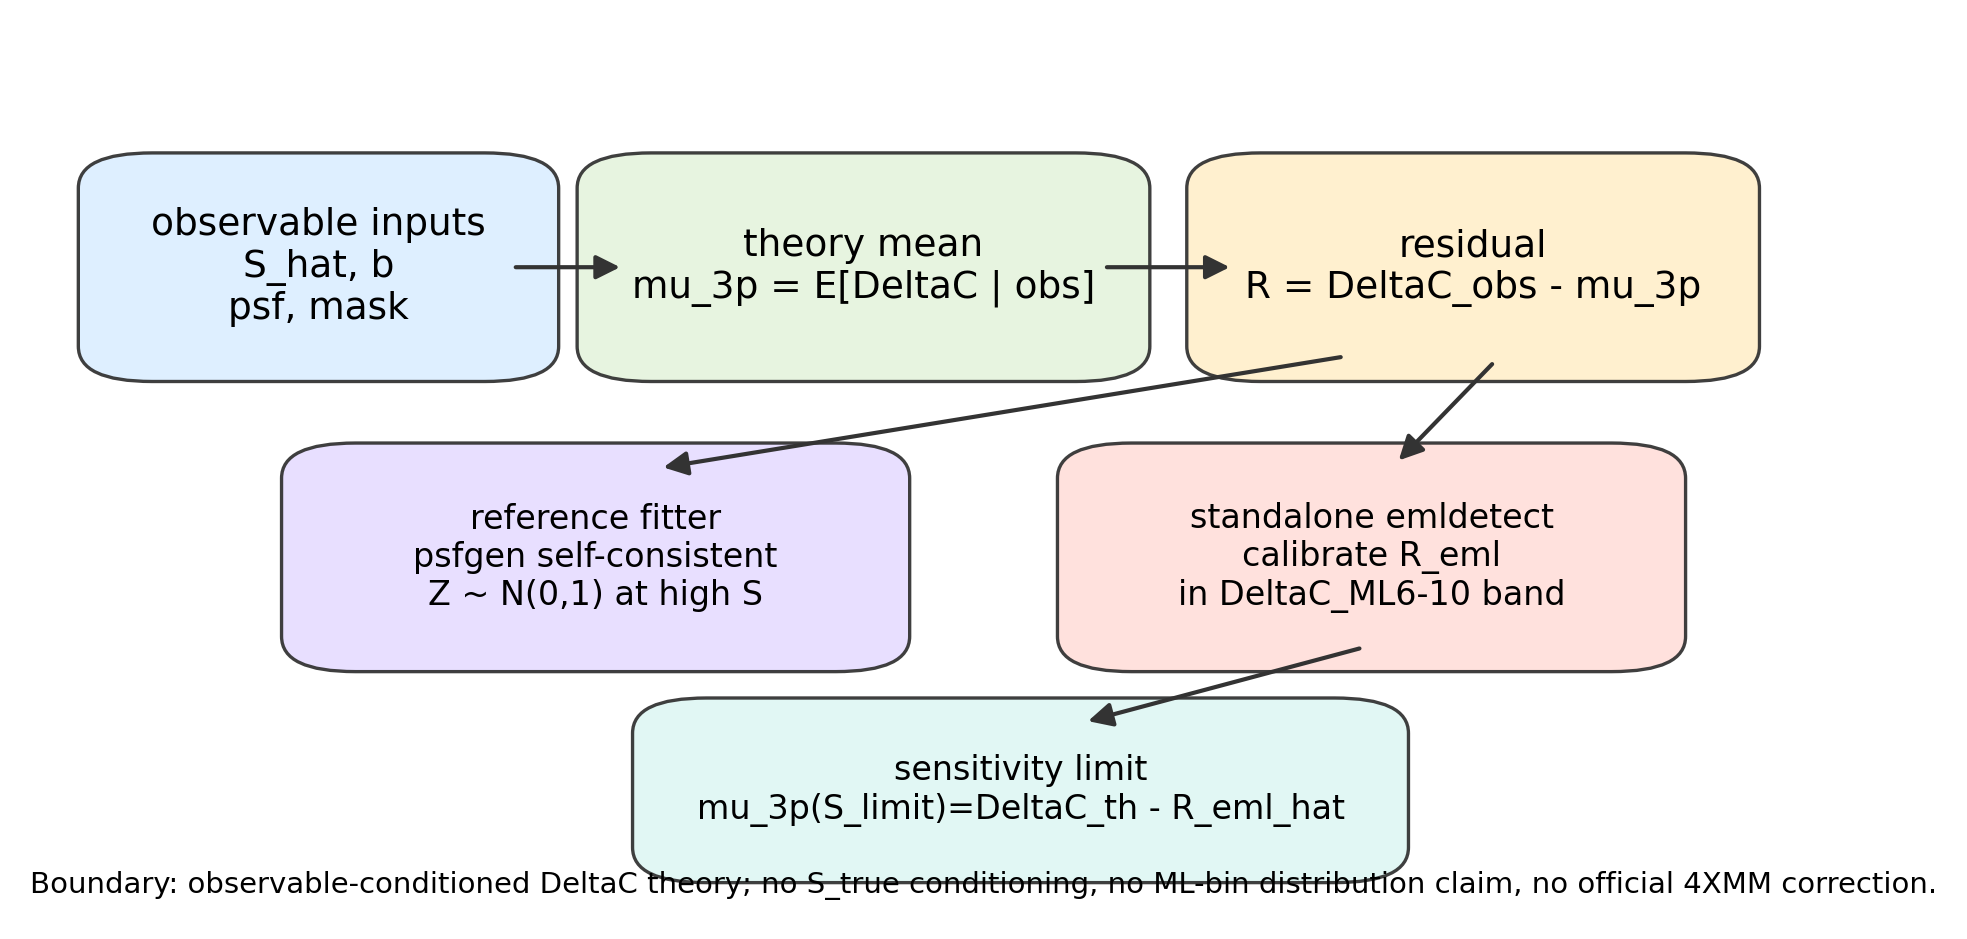
emldetect is then handled by measuring the threshold-band
residual
and solving
.Why the conditioning variable is S_hat, not S_true
In simulations, the injected source strength
is known and gives cleaner diagnostic plots than
,
but it is not an available conditioning variable for detection theory:
is absent from every real image and every emldetect source
table, and it is unavailable when constructing sensitivity maps. Without
injecting information that does not exist in the use case, a theory
conditioned on
cannot be applied to real detection or false-source recovery tests.
Throughout this paper,
denotes only a simulation-generation label, while
is the conditioning variable. Results conditioned on
test whether the model behaves sensibly at a known injected flux;
results conditioned on
test whether it is usable after the detection fit. Only the latter is
relevant to standalone emldetect sensitivity-map work.
Residual decomposition
For each source or false-source trial, the theoretical prediction is evaluated at the observed fitted quantities:
The residual is:
For a sample or bin:
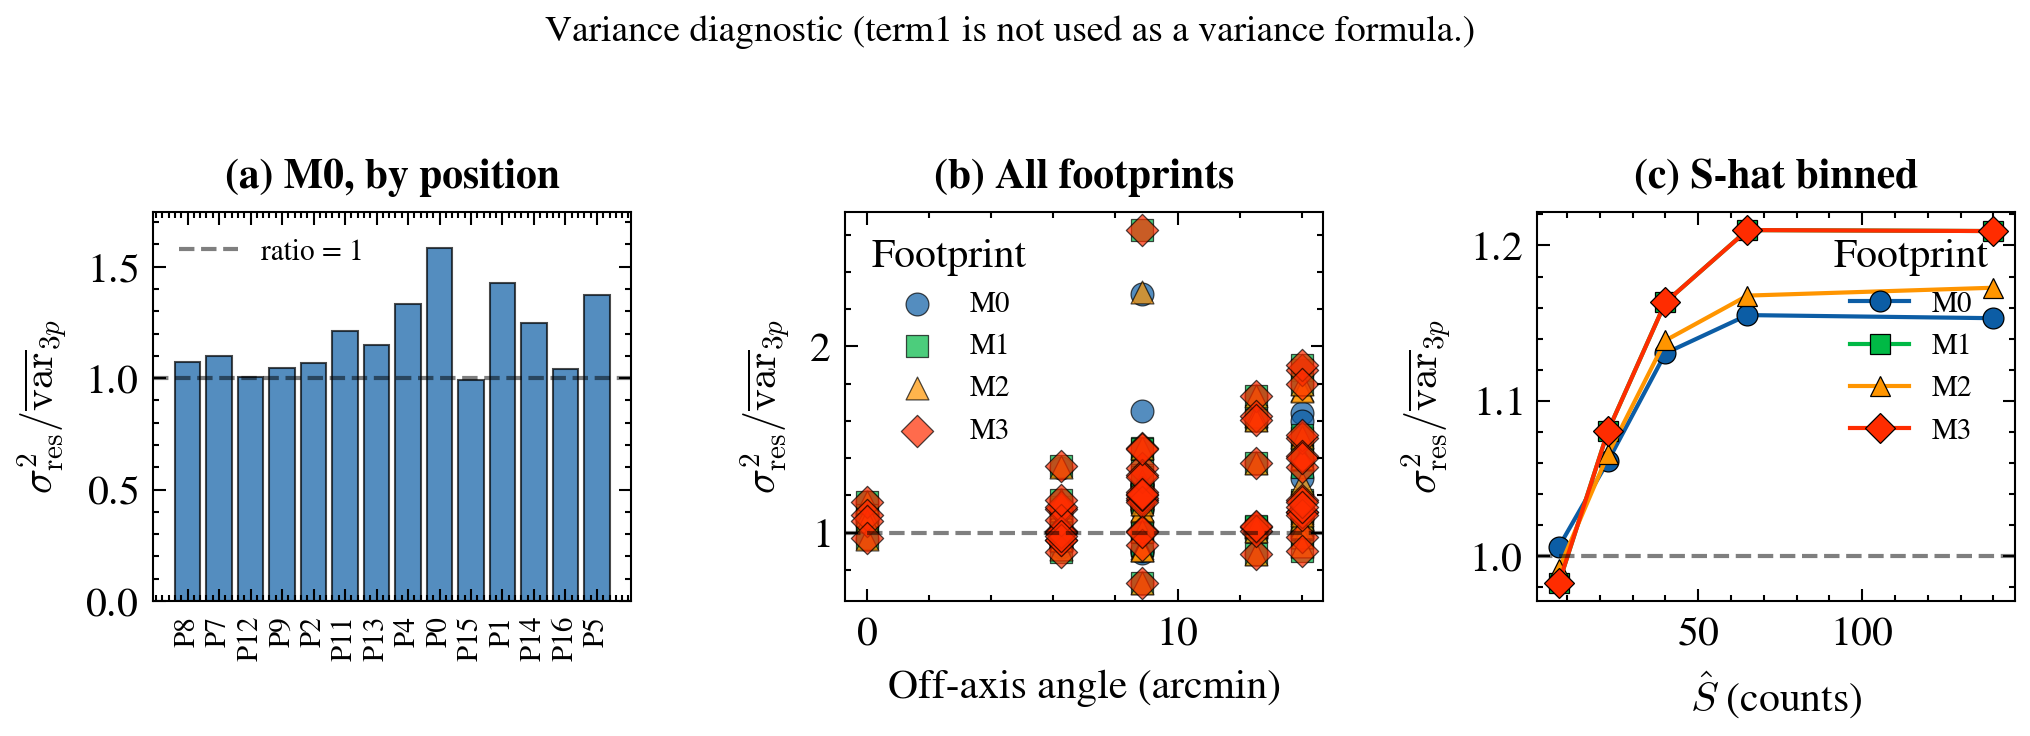
Only when is approximately constant across the bin does the observed width reduce to ; otherwise, mixed- or mixed-position samples introduce apparent variance effects that are not properties of the conditional theory. Single- residual bins show to be nearly correct on-axis and low at off-axis positions.
Thresholds are translated to DeltaC, not selected on observed DET_ML
DET_ML is a nonlinear monotonic tail-probability
transform of
,
For a single-source three-parameter fit,
and
.
A Gaussian residual in
is therefore no longer Gaussian in DET_ML, and selecting on
the observed DET_ML means selecting on the very noisy
quantity whose distribution we are measuring — it truncates the residual
distribution and biases its mean upward near the threshold. Threshold
ranges are therefore translated to
:
and used as the theory or predicted conditioning (for example $\mu_{3p,\rm ref}\in[\Delta C_\mathrm{ML6},\Delta C_\mathrm{ML10}]$), or as the bins in which the typical predicted falls in that interval. This makes the conditioning independent of the observed random fluctuations in .
Three-Parameter DeltaC Theory
This section gives the closed-form derivation of the conditional mean and approximate variance of for the standard single-source PSF fit (one free amplitude and two free position coordinates).
Pixelized Poisson model
Consider a fit region containing pixels indexed by . The observed counts are independent Poisson random variables,
For a single source on a locally known background, the fitted source model is
Here is the background expectation in pixel , is the source amplitude in the same units as the image model, and is the pixelized PSF template translated to position . In the current PN band-4 validation runs, is usually a constant within the fit region, but the notation allows the background to vary per pixel.
The binary fit mask selects the pixels included in the fit:
The mask represents the adopted fit footprint, for example the
‘ecut=15‘ pixel cut used in the standalone emldetect
threshold calibration. A weighted-mask extension exists for fractional
masks, but the main results of this paper use binary masks.
Cash statistic and DeltaC sign convention
Ignoring constants independent of the model parameters, the Cash statistic is
$$C(\theta) = 2 \sum_i M_{i} [ \\mu_i(\theta) - Y_{i} \log \\mu_i(\theta) ]$$
The null model is the background-only model,
The likelihood-ratio Cash improvement is
Under this sign convention, a better source fit gives a positive . At a fixed fitted model , the statistic can be written as
This is the quantity later converted to the SAS ‘DET_ML‘. This paper never uses the catalog-column convention (in which the stored auxiliary quantity may represent ); the theoretical here is the full Cash difference .
Conditional mean at fixed fitted result
The observable-conditioned theory evaluates the moments at the fitted result
The Asimov image of the fitted model is , the reference dataset that suppresses all statistical fluctuations at the fitted model (Cowan et al. 2011). Substituting it into the Cash improvement gives the conditional mean
If the position parameters are frozen in this expression and only the amplitude degree of freedom is kept, it reduces to the sensitivity-mean expression given by Stewart (2009) for single-parameter Cash detection (whose form additionally contains an empirical constant offset, to which we return in Section 4.5). The generalizations of this paper are three: the conditioning variable is the fitted amplitude rather than the model amplitude, the fit mask is carried explicitly, and the projection term of the variance for the two free position parameters is supplied below.
For a constant background
and a normalized PSF
,
this is the expression implemented in
deltac_moments_3param:
The mean depends on the pixelized PSF and the mask through the full pixel sum. It is not only a function of the Gaussian width or low-order PSF moments, although those summary quantities can serve as useful diagnostics.
Linearized score constraints
The best-fit parameters satisfy the score equations. For any fitted parameter ,
Linearizing around the fitted model, write
The first-order score constraints are
There are three such constraints:
These constraints are why the three-parameter fit is not equivalent to a simple unconstrained Poisson sum. Fluctuations along the fitted amplitude and position directions are absorbed by the fit and must be projected out when computing the residual variance.
DeltaC residual variance before projection
At the fixed fitted model, the first-order stochastic part of is
If the fitted parameters were not constrained by the score equations, the variance of this linear residual would be
This term is useful as a diagnostic, but it is not the final variance formula for the fitted likelihood ratio. It ignores the fact that , and were chosen to maximize the likelihood.
Fisher projection for three fitted parameters
Define the Fisher information matrix of the three fitted parameters:
For , its elements are
The covariance between the residual and the score directions is encoded by
Specifically,
Under the Gaussian/Fisher approximation, conditioning on the fitted score constraints subtracts the projection of the residual onto the fitted-parameter subspace. This is the imaging realization of the Wald-type asymptotic argument (Cowan et al. 2011): the fluctuation directions of the fitted parameters are characterized by the Fisher information, and the components of the likelihood-ratio residual along those directions are absorbed by the fitting process. The resulting variance is
This is the fitposition=True formula in
lib/fit_mask_3param.py. If the position directions are
removed and only
is fitted, the formula reduces to the amplitude-only single-parameter
expression.
Schur complement implementation
The code uses a block inverse to evaluate the three-parameter projection. Write
where contains the cross-terms between and the positions, and is the position block for and . Then
This is algebraically equivalent to inverting the full Fisher matrix, but it makes the position projection explicit and is numerically convenient for handling large grids of and values.
Mask and weighted-mask conventions
For binary masks, the sum above runs only over pixels with
.
This is the main convention used in the current PN band-4 standalone
emldetect calibration.
For fractional weights , the weighted statistic is
The corresponding variance uses
in both the Poisson variance and the score-covariance terms. Hence the
weighted implementation in weighted_deltac_moments_3param
uses
and the weighted Fisher projection. When the weights are exactly 0 or
1, the weighted implementation reproduces the binary-mask formula. This
paper does not claim to reproduce all internal SAS mask conventions; it
uses the validated binary convention for the standalone
emldetect calibration described here.
DET_ML convention
This paper uses the SAS emldetect natural-log
convention:
For a single-image fit with three fitted parameters, the chi-square degrees of freedom are
Therefore
The second argument of gammaincc is
,
not
.
This log is the natural logarithm, not
.
The inverse transform is
This is implemented in lib/detml.py with
.
The thresholds for the sensitivity-map band are
These values define the
band of interest. They are not the observed DET_ML
screening values used to measure the conditional distribution.
Validity range of the variance approximation
The variance expression is a local Gaussian/Fisher approximation around the fitted model. When the likelihood surface is close to quadratic and the fitted source is strong enough that position optimization does not absorb isolated Poisson noise features, the approximation is expected to be accurate. The corrected single- variance diagnostic is summarized in Figure 2.
Self-consistent reference-fitter validation
The predictions of Section 3 are validated on a self-consistent
reference fitter in which source injection, source fitting and
theoretical moment computation all use the same psfgen template PSF
family. This test isolates the
theory itself; the standalone SAS emldetect is handled
separately in Section 5.
Simulation design
The reference validation uses I044 high-statistic psfgen template simulations:
instrument: PN
band: band 4
positions: 17
S_true grid: 8 values
b grid: 6 values
repetitions: 1000 per cell
total rows: 816,000
clean rows: 811,194
Each simulated source is fitted with a three-parameter Poisson likelihood fitter. For each row, the theoretical values are evaluated at the fitted source strength:
The diagnostic residual is
This is an observable-conditioned validation because the prediction uses the fitted amplitude , not the injected amplitude . Here is the name of the fitted amplitude in the simulation table; it is the same observable physical quantity used in the theory chapter.
High-signal (High-S) closure
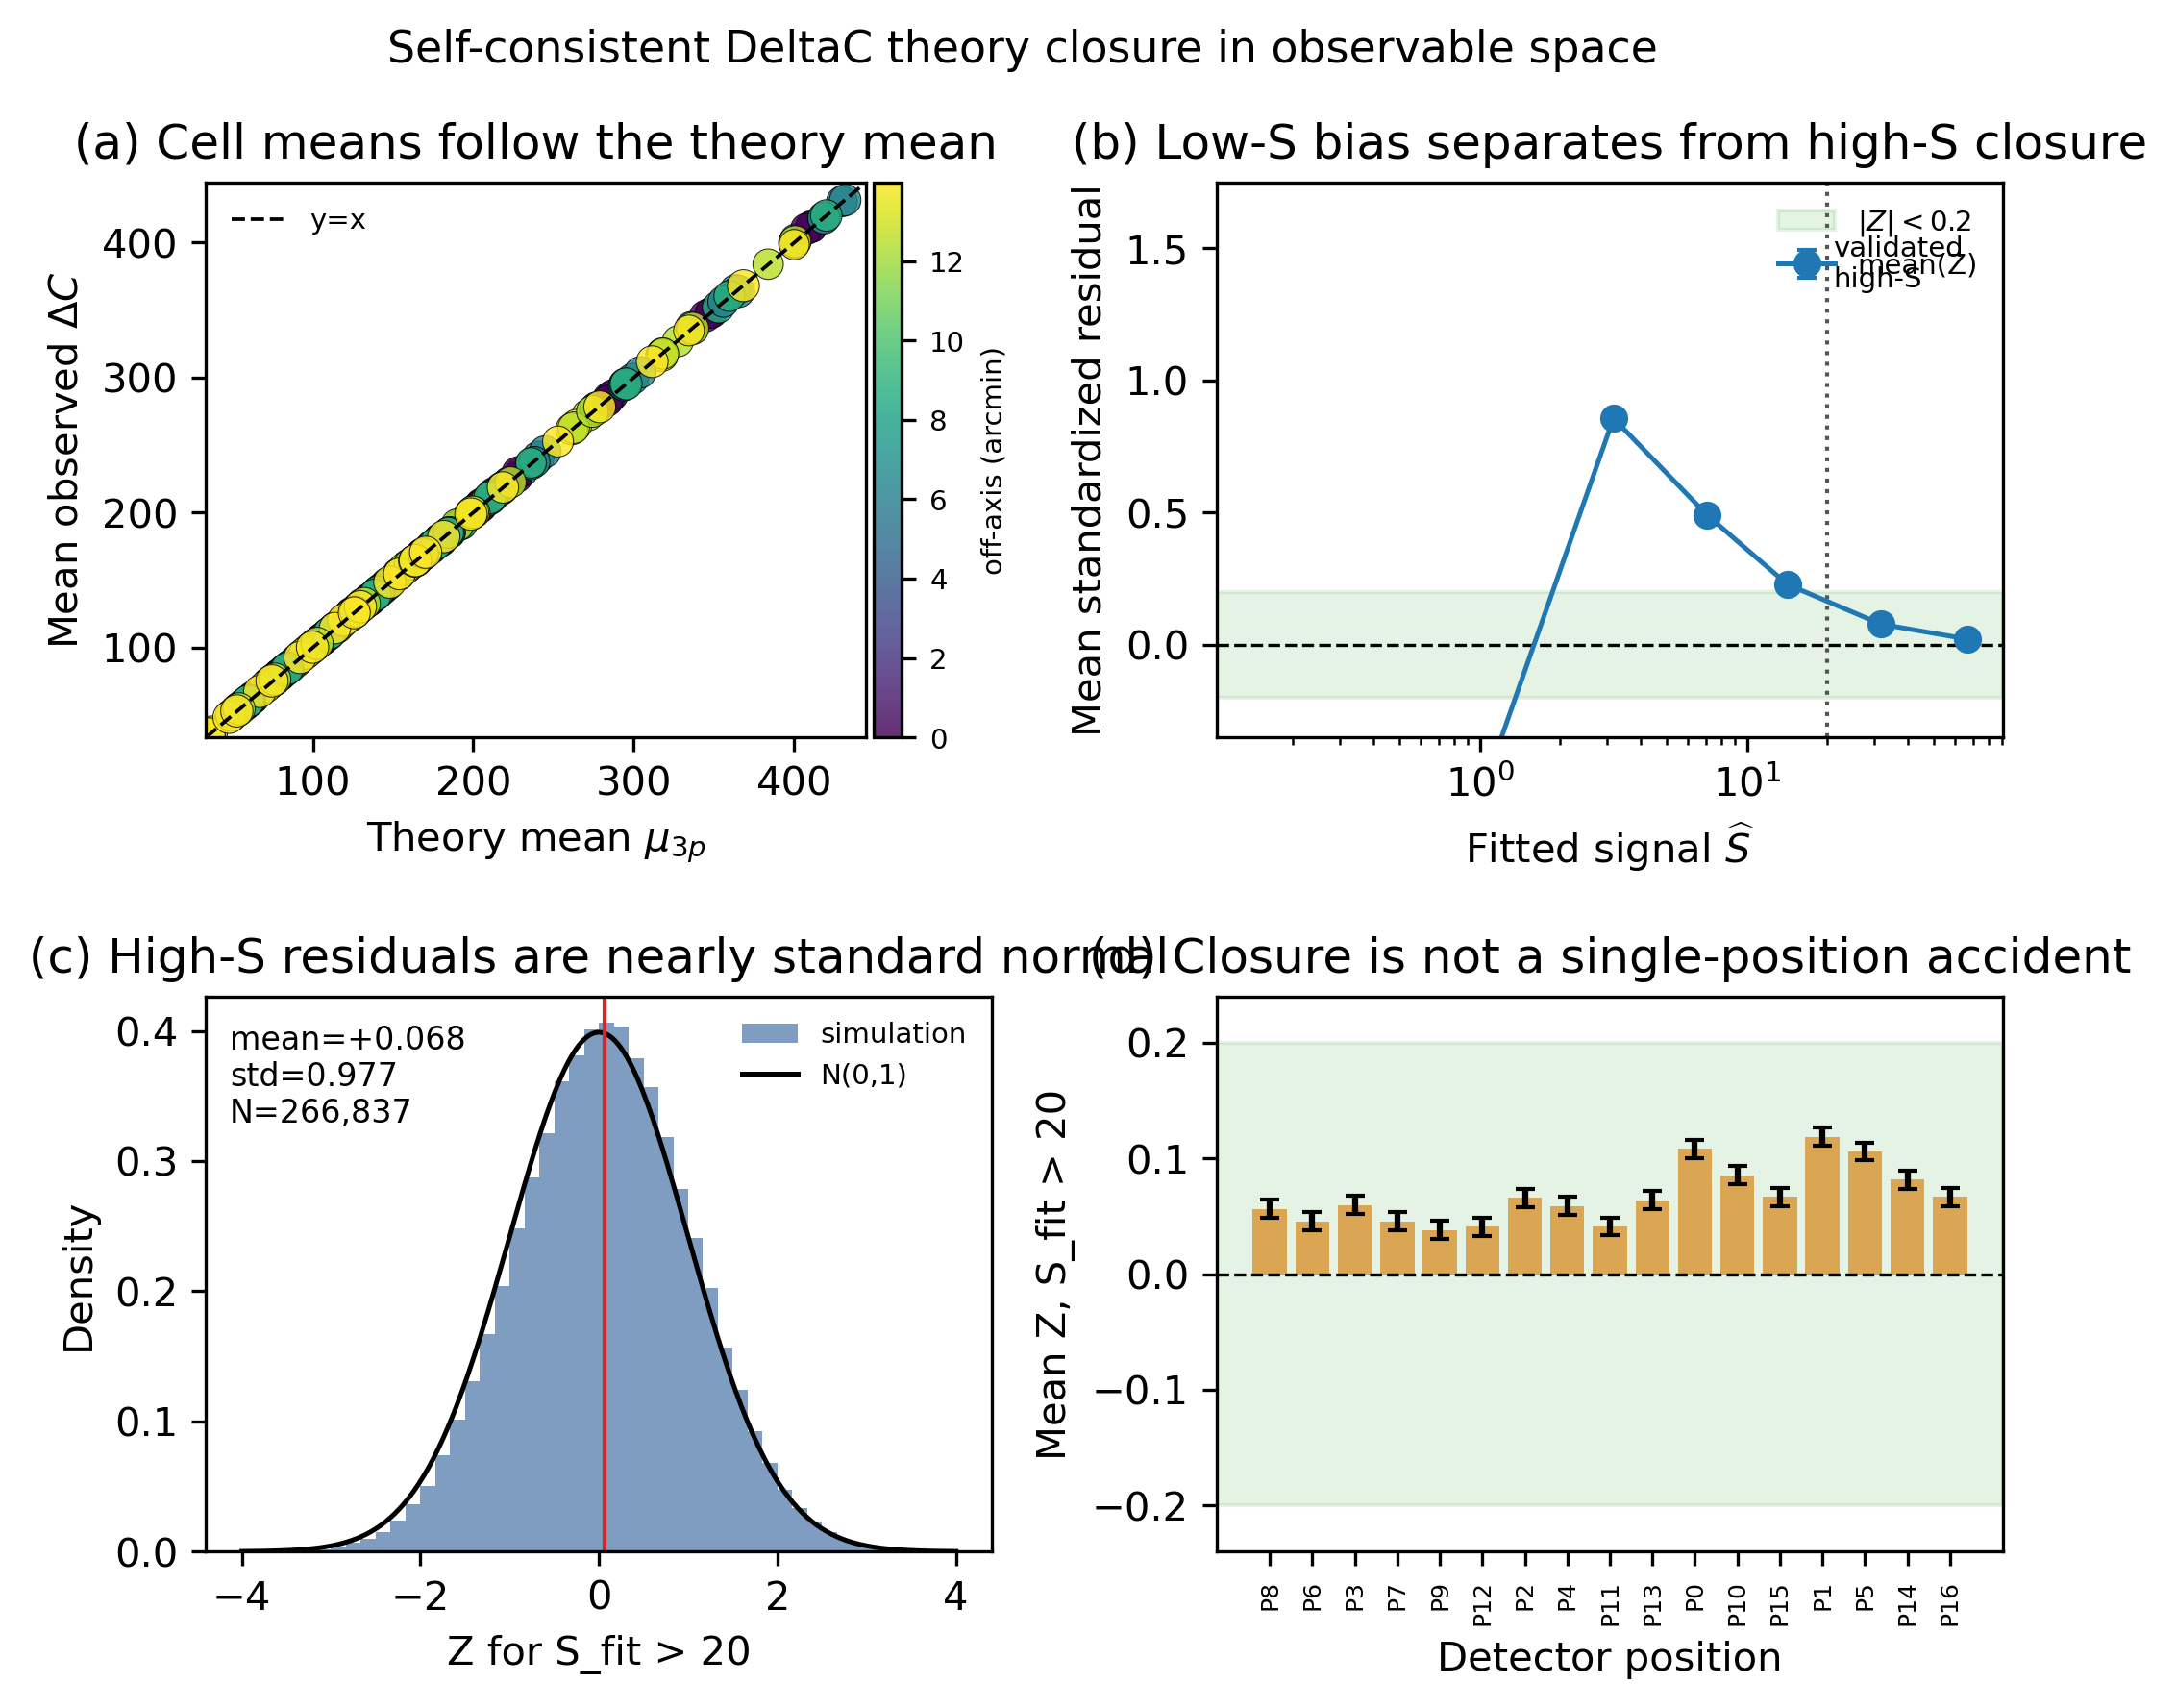
For , the self-consistent reference fitter achieves closure at the level required by the paper’s theoretical claims:
Self-consistent reference fitter closure summary.
lr Physical quantity &
ValuePhysical quantity &
Value
Total simulated rows & 816,000
Clean rows & 811,194
Rows with S_fit > 20 & 266,837
mean(Z) for S_fit > 20 & +0.0678
std(Z) for S_fit > 20 & 0.9770
Per-position mean(Z) range & [0.0380, 0.1187]
mean(Z) for S_fit > 50 & +0.0218
The stronger subset is closer to zero mean and unit width. This is the expected asymptotic behavior of the Fisher/Gaussian approximation in the high-signal regime.
Figure 3 is the main theoretical proof figure. It shows that the cell-averaged follows , that the low- bias and the closure band are clearly separated, that the high- standardized residuals approach the standard normal distribution, and that the closure is stable across detector positions. Table [tab:high-s-closure] gives the corresponding numerical summary.
Low-signal (Low-S) beyond-Fisher bias
The same validation shows that the theory does not close consistently at low fitted signal. The low- interval has a positive residual bias:
Low-signal beyond-Fisher bias in the self-consistent reference fitter.
lrrr Fitted signal range &
N & mean(Z) &
std(Z)Fitted signal range &
N & mean(Z) &
std(Z)
S_fit < 5 & 137,517 & +0.920 &
0.858
5 <= S_fit < 10 & 192,750 & +0.492 &
0.884
10 <= S_fit < 20 & 214,090 & +0.229 &
0.933
S_fit > 20 & 266,837 & +0.068 & 0.977
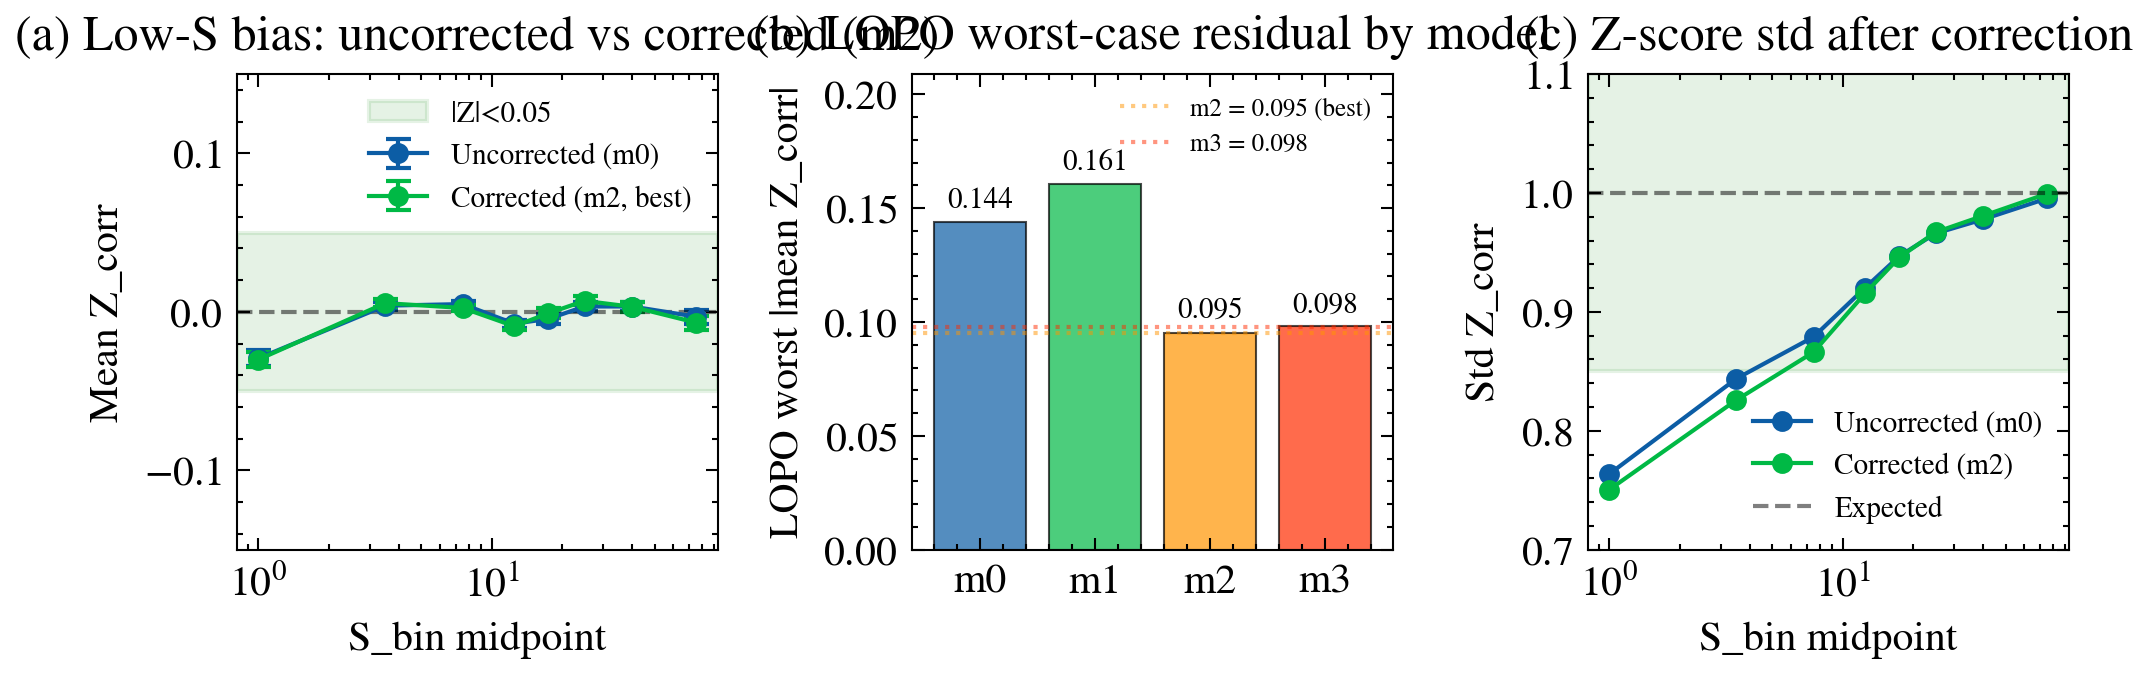
This is the beyond-Fisher interval. Position optimization absorbs positive Poisson noise features, making the likelihood surface difficult to approximate by a local quadratic expansion. This bias is not a grid artifact; the v2/v10b audits identified it as a genuine limitation of the Gaussian/Fisher approximation at low fitted signal.
The m2 simulation correction model using
— where
is the second moment of the local PSF and
is an effective PSF winginess parameter, both derived from
position-dependent psfgen templates — reduces the leave-one-position-out
cross-validation outlier residuals to about 0.095
.
This can serve as a diagnostic tool for
low-
theory error. It is not an independent emldetect
sensitivity-map recipe, since standalone emldetect has
additional implementation residuals.
Figure 4 shows the beyond-Fisher low- bias and the m2 correction diagnostic.
emldetect
sensitivity-map recipe.Why the ML10 interval is not covered by high-signal closure
The sensitivity-map band of interest is DET_ML around
6–10. Under the single-image three-parameter SAS convention,
For the current PN band-4 setup with , this corresponds roughly to –. This is below the high- validation range . Therefore high- closure alone cannot serve as the error budget for a sensitivity map.
The threshold-band problem is different. It asks how precisely the
source amplitude
corresponding to the required
can be recovered after accounting for the
low-
theory bias and the standalone emldetect implementation
effects. This operational calibration is the subject of Section 5.
Closed-form global corrections
The above low-signal bias can be described in compact closed form. In
observable space, binning the reference fitter output by
(using
to constrain the low-signal end), across all 17 positions and 6
backgrounds, the mean residual and residual dispersion ratio can both be
well described by a
expression. These global expressions empirically support the following
interpretation: the residual beyond Fisher is a smooth, low-dimensional
function of
,
with no significant off-axis dependence (Section 4.6). This
smoothness motivates the empirical grid interpolation strategy deployed
in Section 5: if
the residual were chaotic or high-dimensional, sparse grid interpolation
would fail. However, these specific closed-form global corrections are
strictly diagnostic and are not directly used in the final operational
calibration. The standalone emldetect calibration absorbs
all low-signal bias and implementation-specific effects entirely into
the empirical
grid.
The empirical nature of these corrections is itself a constrained result, not merely a modeling convenience. Two direct validation tests (to be presented elsewhere) bound the simpler alternatives. First, a second-order expansion of in the amplitude score (evaluated without fit coefficients) cannot reproduce the five coefficients of Eqs. ([eq:mean-corr])–([eq:sigma-corr]): its mean contribution approximates a constant position-rank gain rather than the observed decay; its variance term cannot give the empirical dispersion deficit. This places the low-signal residual outside local-quadratic or Bartlett-type expansions, consistent with the position argmax mechanism separated in the reference fitter decomposition. That mechanism is structurally homologous to the look-elsewhere effect in high-energy physics (Gross & Vitells 2010): the observed is the supremum of the likelihood over a position search domain, and a Taylor expansion about an interior point cannot represent an argmax over a domain. Notably, Stewart (2009) likewise needs an empirical additive constant (about ) in his single-parameter sensitivity-mean expression to match Monte Carlo results, and that constant degenerates after discarding negative-amplitude fits — qualitatively consistent with the low-signal additive mean shift we measure here, which can be viewed as an early sign of the same effect in the single-parameter case. The difference is that in our three-parameter production setup the shift is not constant but decays as and depends on background. Second, a cross-PSF-transferability test using a Gaussian pixel, a wide Gaussian pixel, and a King pixel, toy configuration (with the same mask) shows that the correction coefficients are PSF-family-specific: the Gaussian toy mean law and the XMM-psfgen template production law differ at high significance in the most precise low bin, and neither nor allows merging the mean coefficients across PSF families. Therefore the low-signal correction must be calibrated per PSF template family. Within the XMM psfgen template family used in this paper, the 17-position off-axis stability shown below is precisely the validated operating domain.
Two further consequences of this PSF-family perspective are worth
recording here. They build on a pilot study covering three EPIC cameras
and two bands, using real psfgen templates prepared through
a single template pipeline. First, once template preparation is unified,
the per-instrument, per-band structure of the correction disappears: the
five coefficients simplify to a tag-free form where three are shared
constants and two are smooth univariate functions of scalar PSF features
(effective PSF area and peak pixel fraction), and the model no longer
retains any instrument or band label. The full presentation of this
simplified tag-free correction law is deferred to a follow-up paper.
Second, directly relevant to the application of any correction in this
paper: the absolute value of the correction coefficients depends on the
PSF template preparation convention (high-resolution sampling,
recombination, cropping and normalization choices). Calibration and
deployment must therefore use the same template pipeline; coefficients
calibrated under one preparation convention must not be combined with
templates prepared under another convention.
The conditional mean is corrected additively:
where , , (uncertainties from position-level bootstrap, see below), and the residual dispersion is corrected multiplicatively:
where , . The dispersion correction has the form of a low-signal deficit that vanishes in the asymptotic limit and returns the Fisher-projected variance at high fitted signal. Eq. ([eq:sigma-corr]) reduces the bin-level scatter of the empirical-theory ratio from (uncorrected) to , with residuals consistent with the Monte Carlo uncertainty of the per-bin scatter estimate. At the highest background () and lowest fitted signal there remains a mild residual where the empirical deficit is flatter in than the global form; this interval lies well below $\DETML=6$ and does not affect the validated operating range.
Off-axis independence of the corrections
The two corrections in Eqs. ([eq:mean-corr])–([eq:sigma-corr]) depend only on the fitted amplitude and background. Adding a linear off-axis term to the scatter model barely changes the fit quality ( per arcmin; root-mean-square residual unchanged to three decimals), and the empirical ratio stays flat at – over the full – off-axis range. Thus the apparent "off-axis" variance shift is not an off-axis effect: it is the low deficit of Eq. ([eq:sigma-corr]), since those positions sample a larger fraction of low fits and so show up more strongly in off-axis rings. Within the validated domain, a single correction suffices for all detector positions. This intra-family stability, contrasted with the cross-family dependence discussed above, delineates the validity boundary of Eqs. ([eq:mean-corr])–([eq:sigma-corr]).
The coefficients are stable under changes in the number of detector positions used in the fit. Position-level bootstrap (resampling the 17 positions with replacement, 400 realizations) recovers the central values cited above and provides the basis for the uncertainties in Eqs. ([eq:mean-corr])–([eq:sigma-corr]). Resampling random position subsets of fixed size keeps the central coefficients within the scatter and shrinks their spread as , showing that the positions independently sample the corrections with no systematic off-axis trend.
Limitations of high-signal asymptotic closure and the role of empirical calibration
The sensitivity-map band of interest is $\DETML$ around 6–10, corresponding to –. For the current PN band-4 setup with , this corresponds roughly to –. This is strictly below the high-signal validation range . We therefore explicitly state: the high-signal asymptotic closure of Section 4.2 does not directly validate the theory operationally in the threshold band. In this low-signal interval, the threshold-band residual is handled by pure empirical interpolation.
Physically,
comes from three sources: (i) the beyond-Fisher bias of the
theory itself near the
boundary, where the non-negativity constraint violates Wilks’ theorem
interior-point assumption; (ii) implementation-specific artifacts of
standalone emldetect, including its internal optimizer, PSF
sampling and numerical discretization details; (iii) the difference
between the
fit footprint used in the theory and the mask actually applied by the
pipeline. Although
is in principle a function of
,
it varies slowly enough over the narrow threshold band
(–)
to be robustly approximated as a scalar offset per position. Paired-seed
experiments comparing the self-consistent reference fitter and
standalone emldetect show that independent
tracks the reference fitter almost perfectly (correlation 0.996), with a
small affine offset and an implementation jitter growing with off-axis
angle; this supports treating the transfer from reference theory to
independent pipeline as an empirical implementation layer rather than a
change to the observable-conditioned form itself.
A standard Monte Carlo false-source-injection method (e.g. the
esensmap simulation mode) would automatically capture all
these effects: inject sources at each sky position and background level,
run the full pipeline, and tabulate the detection fractions numerically.
This method, which makes no theoretical approximation, offers excellent
absolute accuracy. However, for full-sky mapping over the full range of
background, off-axis angle and PSF geometry encountered in survey-scale
sensitivity maps, it is computationally prohibitive. Large modern
surveys therefore rely on extensive end-to-end simulations to
characterize completeness, purity and selection thresholds, as in the
eROSITA eFEDS source-detection calibration (Brunner et al.
2022; Liu et al.
2022).
The scientific value of the Section 3 theory is that it provides the correct functional form of the observable-conditioned expectation, since background, PSF geometry and mask vary continuously across the detector. By anchoring the computation to the deterministic theoretical mean , operational calibration only needs to empirically determine the slowly varying scalar residual on a sparse grid. This hybrid approach (analytic backbone plus empirical residual calibration) sacrifices the absolute accuracy of full Monte Carlo (the recovery error of 11–17% reported in Section 5) but avoids the extreme computational cost of dense false-source injection at every sky position. This operational calibration is the subject of Section 5.
Standalone
emldetect threshold calibration
The standalone SAS emldetect uses its own source
fitting, optimizer and PSF/model conventions; these implementation
details generate position-dependent residuals relative to the reference
theory derived in Section 3. Below we construct an empirical,
position-dependent residual calibration that absorbs this bias for the
threshold interval DET_ML=6–10, suitable for independent
false-source sensitivity-map work.
Why
standalone emldetect needs a separate residual
The raw theory prediction is
If standalone emldetect matched this model exactly, the
threshold limit could be found by solving
In practice, this zero-residual formulation is only a borderline
approximation within the threshold band. In the v13b validation, the raw
recipe O0 has a maximum
error of 19.9% at DET_ML=6, 15.6% at DET_ML=8,
and 13.3% at DET_ML=10. The error is position-dependent,
not a single scalar offset.
The failure of full observable-conditioning for standalone
emldetect closure is shown in Figure 5. Figure 6 shows that increasing
the detector footprint variants does not remove the off-axis bias.
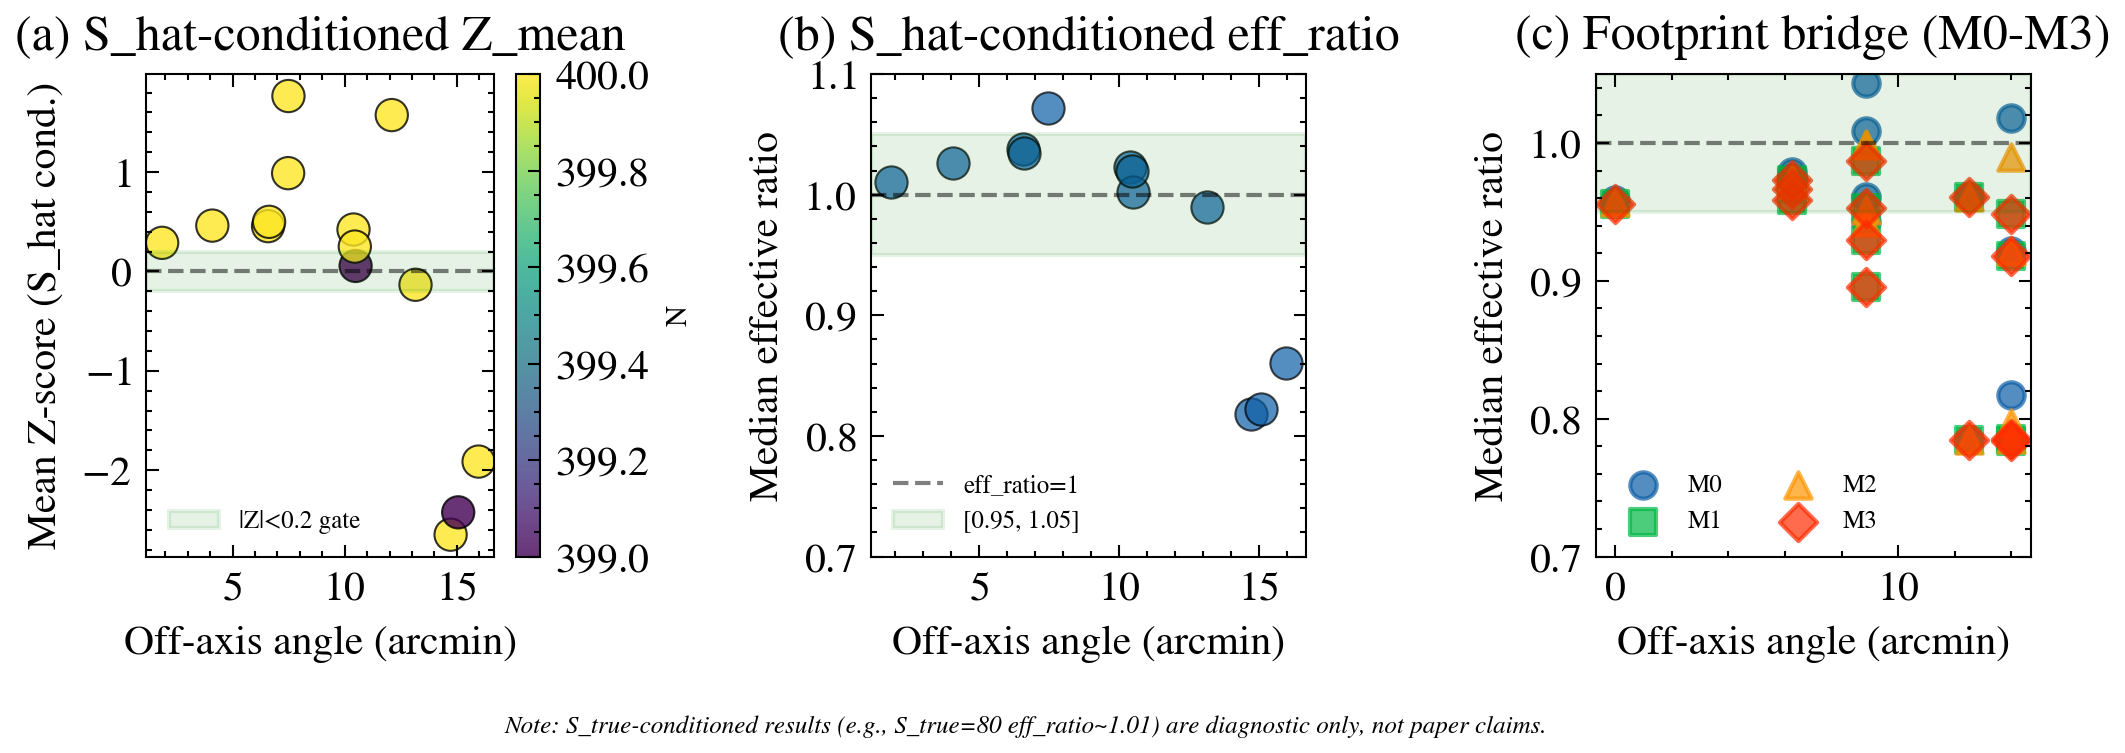
emldetect
closure limitation. The residual structure motivates the measured
threshold-band residual calibration, not the zero-residual raw theory
claim.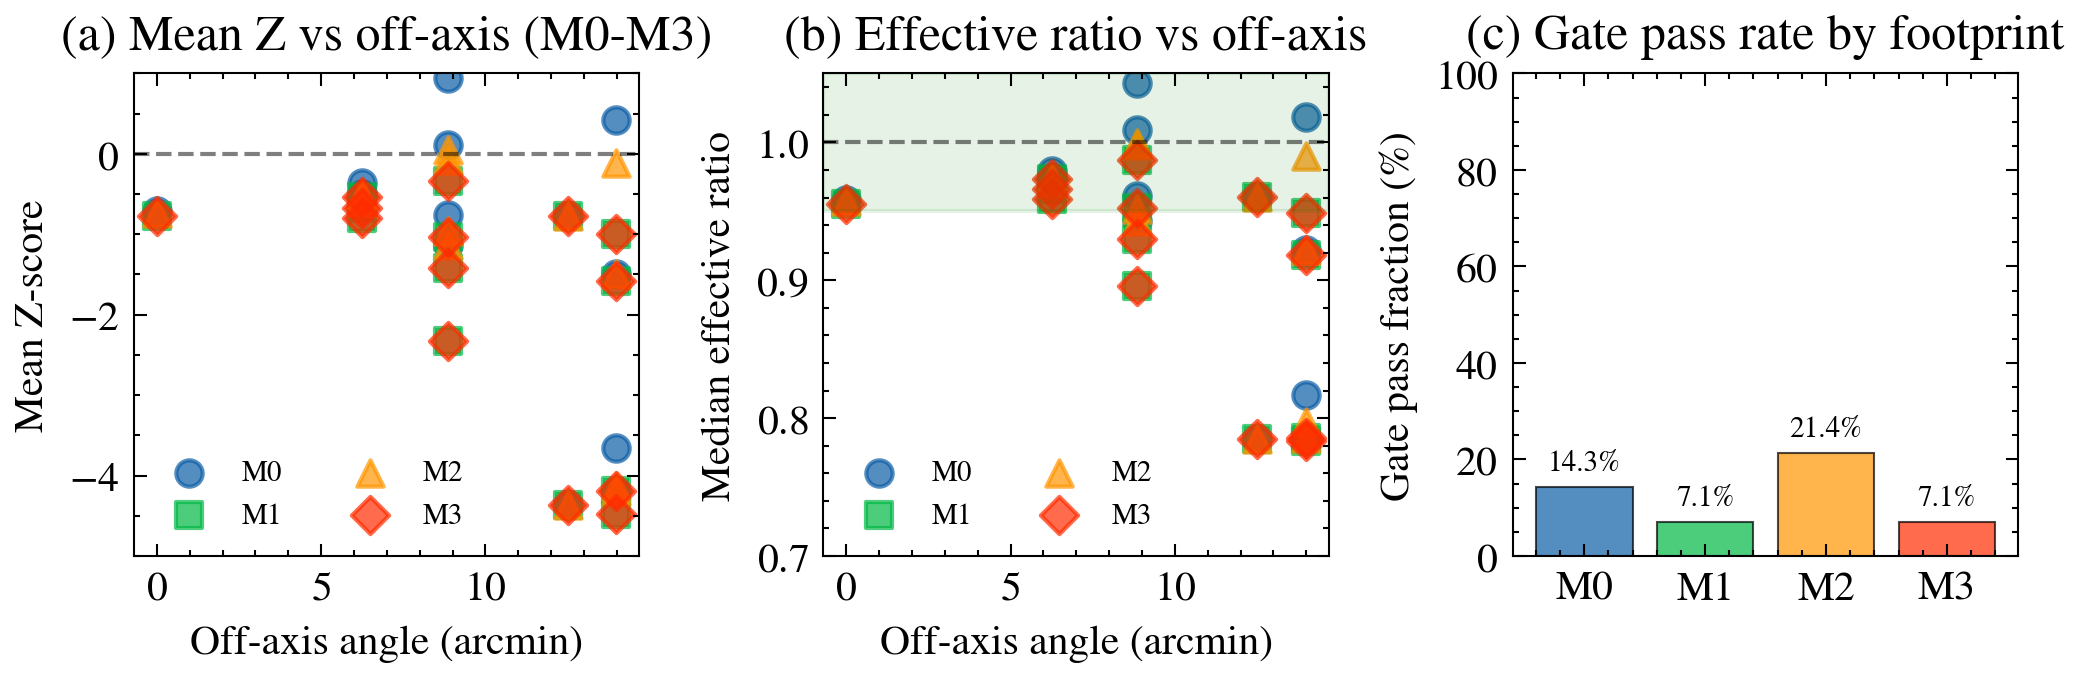
emldetect bias.Therefore, we define the standalone emldetect residual
as:
where
is the standalone emldetect Cash improvement converted
under the single-image
convention, and
is the fitted emldetect source amplitude. The calibrated
threshold equation is:
This sign follows directly from the definition of the residual. If
,
standalone emldetect produces a larger
than the raw theory at the same fitted source strength, so the
theoretical threshold required for the sensitivity limit is lower. If
,
a higher source strength is required.
Threshold-band calibration sample
Calibration uses paired false-source simulations, where each
realization is analyzed by both the reference fitter and the standalone
SAS emldetect. The current production grid has 14 PN band-4
calibration positions; P3 is excluded due to a detector-edge
anomaly.
The target threshold band is defined in space:
Rows are selected based on the reference theory prediction:
This is very important. The threshold sample is not selected on the
observed
DET_ML,
nor on the observed
,
because these quantities carry the random fluctuations and
implementation residuals we are trying to calibrate. The selection is
based on the predicted/reference
from the observable-conditioned theory.
The baseline calibration grid is built on:
The background shift toward and is tested separately in Section 5.6.
Recipe definitions
We compare four recipes.
O0: Raw theory.
Set
and solve
This tests whether the theory can be used without standalone
emldetect calibration.
O4-global: Scalar residual correction.
Use a single mean
for all positions. This tests whether the standalone
emldetect residual can be treated as a global offset.
O4-lin: Position-dependent 2D linear
interpolation.
_ is estimated by linear interpolation on the production coordinate
sector_phi, restricted to leave-out positions inside the
calibration-grid convex hull.
O4-nn: Nearest-neighbor fallback.
Estimate
from the nearest calibration position in the same coordinate space. This
is the fallback scheme for positions outside the O4-lin convex hull.
The production coordinates are:
sector_phi is a calibration binning coordinate with four
quadrant codes (0, 90, 180, 270 degrees). It is not the
physical detector azimuth. The physically defined DETX/DETY
coordinates are retained as reference and future-work coordinates, but
v15 shows they are not yet production-ready.
Leave-one-position-out validation
Validation uses leave-one-position-out cross-validation (LOPO): each position is held out in turn, the calibration is built from the remaining positions, and the predicted is compared with the position’s own calibrated truth. The reported error is
The results in production coordinates are:
lcccccl O0 & ML=6 & 14/14 & 7.2% & 19.3%
& 19.9% & borderline
O0 & ML=8 & 14/14 & 5.5% & 14.6% & 15.6% & pass,
uncalibrated
O0 & ML=10 & 14/14 & 4.5% & 11.7% & 13.3% &
pass, uncalibrated
O4-global & ML=6 & 14/14 & 6.3% & 19.6% & 21.6%
& fail
O4-global & ML=8 & 14/14 & 4.8% & 14.9% & 17.8%
& pass
O4-global & ML=10 & 14/14 & 3.9% & 12.4% & 15.1%
& pass
O4-lin & ML=6 & 10/14 & 4.1% & 10.7% & 11.0% &
pass inside hull
O4-lin & ML=8 & 10/14 & 3.1% & 8.8% & 9.1% &
pass inside hull
O4-lin & ML=10 & 10/14 & 2.6% & 7.5% & 7.8% &
pass inside hull
O4-nn & ML=6 & 14/14 & 3.7% & 10.5% & 17.2% &
pass fallback
O4-nn & ML=8 & 14/14 & 2.9% & 7.9% & 12.7% &
pass fallback
O4-nn & ML=10 & 14/14 & 2.5% & 6.4% & 10.1% &
pass fallback
The main conclusions are:
O0 is usable only as a coarse fallback. It is borderline at
DET_ML=6.O4-global fails at
DET_ML=6, so a single scalar correction is not sufficient.O4-lin is the preferred interpolation inside the hull.
O4-nn is the full-position fallback scheme and passes the 20% limit grid in the current 14-position calibration set.
O0 passes the 20% limit grid at DET_ML=8 and
DET_ML=10, but the most demanding edge in the
sensitivity-map band is DET_ML=6. At this position O0 is
only borderline while O4-global fails, motivating the position-dependent
O4-lin/O4-nn residual calibration.
For O4-lin in sector_phi, the four leave-out positions
outside the hull are P1, P8, P12
and P16. These positions need the O4-nn fallback.
Figure 7 and Table [tab:v13b-recipe] present this recipe comparison as the main result of this work.
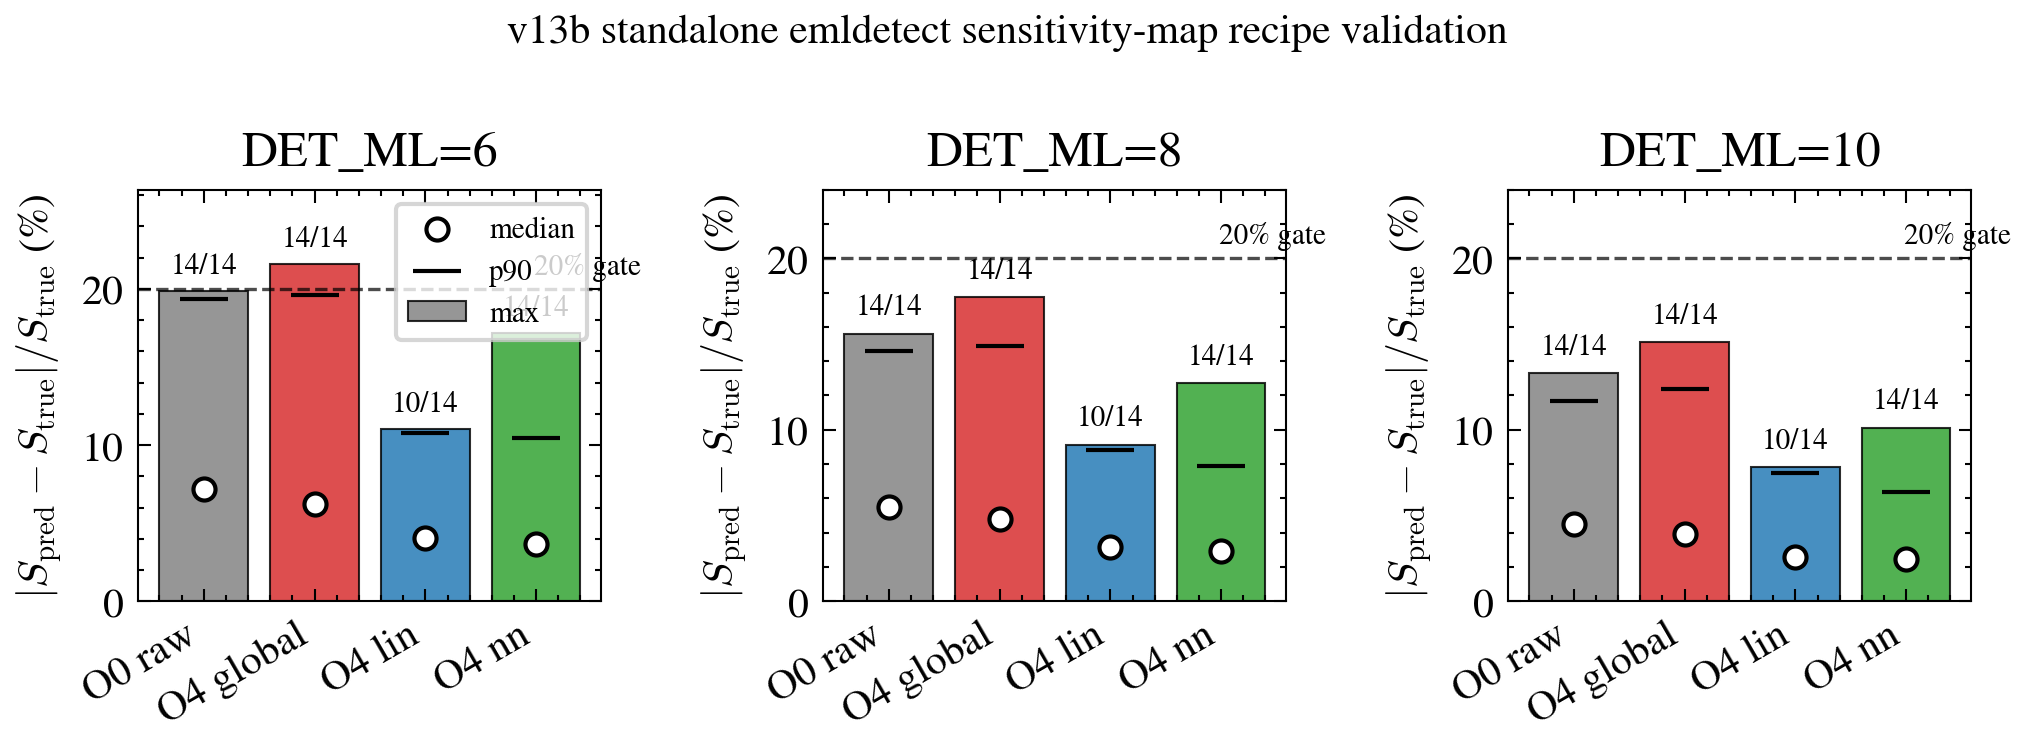
Coordinate decision
Three coordinate choices were tested in v13b:
llccl sector_phi & production &
10/14 & 17.2% & best operational coverage
DETX_DETY & reference/future-work & 6/14 &
18.2% & physically defined but sparse-grid coverage too low
actual_azimuth & diagnostic & 8/14 & 17.6%
& physical angle, intermediate coverage
Therefore the production choice is sector_phi, with a
mandatory warning:
This choice is made for practical reasons. Although
DETX/DETY is better grounded physically, the sparse grid
does not give sufficient O4-lin coverage. v15 tested whether a denser
DETX/DETY grid could fix this and it did not pass the
current production limit grid; see Section 5.7.
Background transfer
The production grid is calibrated at . To test whether the same grid can be used over a limited background range, v13b applies the grid to paired simulations at and .
lcccc b=0.02 & ML=6 & 1.7% &
3.5% & 4.0%
b=0.02 & ML=8 & 1.3% & 2.6% & 3.0%
b=0.02 & ML=10 & 1.1% & 2.1% & 2.4%
b=0.08 & ML=6 & 1.2% & 2.8% & 5.7%
b=0.08 & ML=8 & 1.0% & 2.2% & 4.1%
b=0.08 & ML=10 & 0.8% & 1.8% & 3.2%
Compared with the LOPO interpolation error, the transfer error is very small. A rigorous statement suitable for the paper is:
R_eml has a weak background dependence between b=0.02–0.08, with a maximum tested S_limit transfer error of 5.7%.
Calling this calibration fully background-independent is incorrect. Figure 8 shows the same background-transfer validation pictorially.
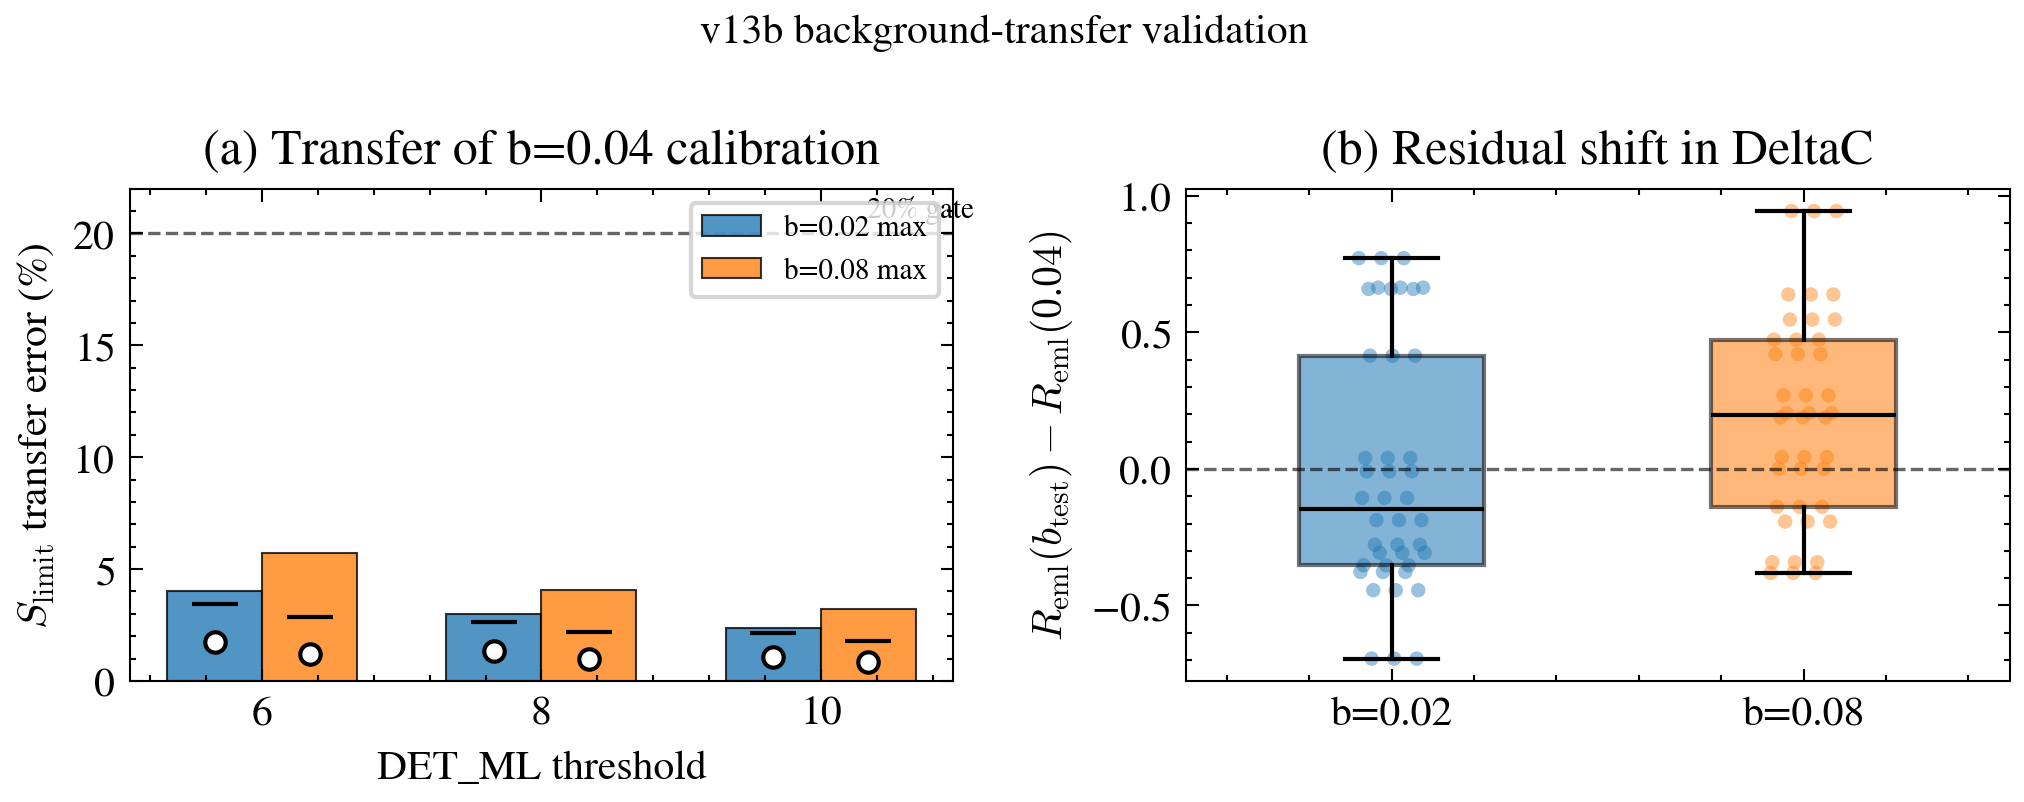
S_limit transfer error of 5.7% when moving the
calibration to
and
supports a weak background dependence rather than full background
independence.Dense DETX/DETY test as a negative result
Calibrating directly on A coordinates on DETX/DETY would
be more physically interpretable than sector_phi, but the
sparse-grid result of Section 5.5 leaves only 6/14 leave-out positions
inside the O4-lin hull. A denser DETX/DETY grid was
therefore tested to ask whether spatial densification could recover the
working coverage. The result is negative:
lcccccl O4-lin & 6 & 20/29 = 69% & 6.6%
& 12.3% & 17.9% & fail coverage <80%
O4-nn & 6 & 29/29 & 8.5% & 17.3% & 26.8% & fail
max >20%
O4-lin & 10 & 20/29 = 69% & 4.1% & 7.7% & 11.5%
& fail coverage <80%
O4-nn & 10 & 29/29 & 5.3% & 11.4% & 17.4% & pass
at ML=10 only
The underlying reasons are:
Hull topology: leave-one-position-out cross-validation leaves boundary positions outside the interpolation hull even when more interior points are added.
emldetectedge failure: detector-edge anchors fail and cannot safely extend the hull.-dependent : a few problem positions show strong source-strength variation in the residual, violating the position-constant-residual approximation.
The v15 result does not supersede v13b. It shows that keeping
sector_phi as the production coordinate and treating
DETX/DETY as reference/future work is reasonable. Detailed
dense-grid results are given in Table [tab:app-v15-dense-detx-dety].
Unified practical sensitivity-map recipe
The Section 3 theory and Section 5 residual calibration together
produce a five-step procedure for evaluating the standalone
emldetect sensitivity limit
at a given detector position and detection threshold, valid within the
PN band-4 single-image three-parameter domain established above.
Inputs and outputs
For each detector position, the required inputs are:
Target DET_ML threshold; per-pixel count background b; pixelized PSF template; binary fit mask / footprint; detector-position metadata; R_eml calibration grid
The output is:
where is the fitted source amplitude corresponding to the expected (i.e. Asimov) equal to the calibrated threshold after residual calibration. It is usually not the 50% completeness flux. The relation between this mean threshold limit and the completeness-percentage limit depends on the conditional distribution in the threshold band, which this paper does not characterize.
Output:
For the current v13b recipe, the validated domain is:
instrument: PN
band: band 4
fit: single-image, three-parameter source fit
nu: 3
background range tested: b=0.02--0.08 counts/pixel
threshold range: DET_ML=6--10
production coordinate: sector_phi
Step 1: Convert DET_ML to DeltaC
The SAS emldetect convention is
For the single-image three-parameter case:
Therefore the threshold inverse-transform formula is
The thresholds actually used are:
SAS single-image three-parameter threshold conversion used by the sensitivity-map recipe.
rr DET_ML &
DeltaC_thresholdDET_ML &
DeltaC_threshold
6 & 14.338539
8 & 18.570072
10 & 22.755959
This conversion must use
as the second argument of gammaincc. It must use the
natural-log convention. The old shape=2.5 transform is no
longer used.
Step 2: Build the local theory function
At the detector position of interest, construct the local PSF and fit mask. The theory function is
For a binary mask this is the pixel sum
The PSF should be normalized using the same convention as the
calibration grid. In the current v13b recipe the mask is the 15-pixel
fit footprint used in the paired standalone emldetect
simulations. A weighted-mask variant exists in the code, but the
production recipe described here uses the validated binary mask
convention.
Step 3:
Estimate standalone emldetect residual
The residual calibration grid is stored in the threshold band:
The production interpolation coordinate is
sector_phi is a calibration block code, not the physical
detector azimuth. For the current 14-position grid, O4-lin interpolation
covers 10/14 leave-out positions. Positions outside the hull are
The interpolation rule is:
if query point lies inside the sector_phi convex hull:
    use O4-lin
else:
    use O4-nn fallback
This fallback scheme is required in current sparse-grid production use. Although O4-nn is not the preferred interpolator inside the hull, it is a validated full-position fallback scheme.
Step 4: Solve S_limit
The calibrated threshold equation is:
The right-hand side is the effective target value in the theoretical reference model. Set:
Then solve
v13b validation used a bracketed root finder:
S_limit = brentq(f, 0.1, 500.0)The approximate linear formula |dR| / dmu_dS should not
be used as a production calculation method. This is the root cause of
the deprecated v13 error (in which DETX/DETY nearest-neighbor errors
were overestimated). This paper’s recipe uses the full nonlinear
solve.
Step 5: Report uncertainty budget
The uncertainty report should state which interpolation branch was used and cite the validated error range.
For sector_phi at DET_ML=6:
Validated uncertainty budget for production coordinates at
DET_ML=6.
lr Component &
S_limit impactComponent &
S_limit impact
O4-lin LOPO median (10/14 in-hull) & 4.1%
O4-lin LOPO max (10/14 in-hull) & 11.0%
O4-nn fallback LOPO median (14/14) & 3.7%
O4-nn fallback LOPO max (14/14) & 17.2%
Background transfer max over b=0.02–0.08 & 5.7%
O0 raw fallback max & 19.9%
For higher thresholds, the interpolation error decreases:
Interpolation errors of the v13b recipe at higher thresholds.
lrr Recipe &
DET_ML=8 maximum &
DET_ML=10 maximumRecipe &
DET_ML=8 maximum &
DET_ML=10 maximum
O4-lin & 9.1% & 7.8%
O4-nn & 12.7% & 10.1%
O0 raw & 15.6% & 13.3%
The recommended wording is:
Within the current sector_phi hull use O4-lin and quote the validated maximum S_limit error of 11.0% at ML=6. Outside the hull use O4-nn fallback and quote the validated maximum error of 17.2% at ML=6.
Distribution
The previous sections calibrated the behavior of the likelihood-ratio statistic in space. The calibrated distribution has two catalog-level uses. The first is interpretive: for traditional -selected catalogs — where the catalog may still be defined by an observed threshold — the forward distribution provides the likelihood needed to infer the corresponding fitted-amplitude distribution. The second is constructive: catalog cuts can be defined directly in fitted-amplitude coordinates by requiring a selected percentile of the local distribution to reach the detection threshold. Both uses rely on the same forward kernel but apply it in opposite directions (Table [tab:two-catalog-uses]).
Here denotes the source-amplitude coordinate used by the observable-conditioned theory; throughout this paper we use the fitted-amplitude convention. It is not the intrinsic injected flux.
Figure 9 shows a
visual version of the construction. The traditional threshold is a
horizontal cut in
space. Reading backwards from this cut gives the fitted-amplitude
distribution of traditional threshold-selected catalogs once a
source-count prior is specified. Reading forwards gives percentile
crossing: the usual sensitivity map is mean crossing, while
lower-percentile crossing defines a more conservative fitted-amplitude
threshold-crossing cut. Standalone emldetect applications
additionally include the pipeline residual calibration described in
Section 5.
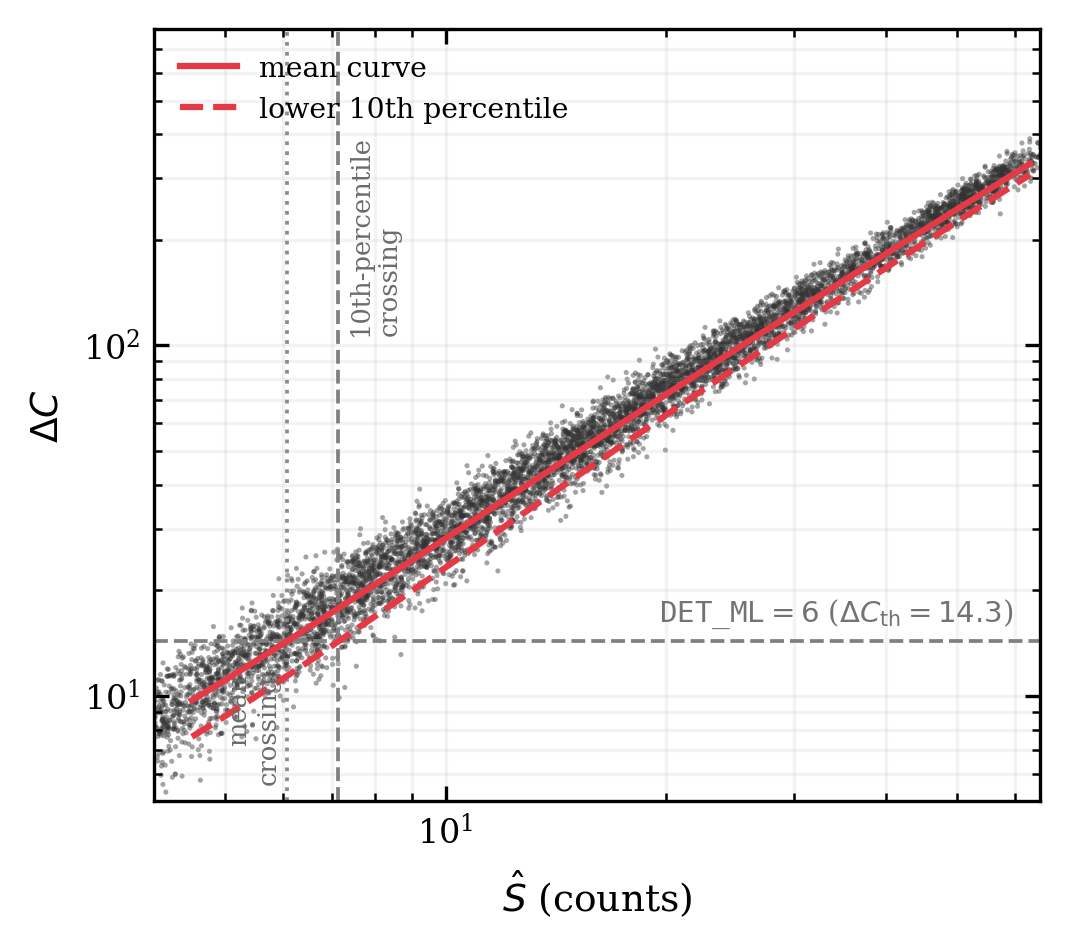
emldetect
applications additionally include the pipeline residual calibration
described in Section 5.lll
Traditional catalog & Backward:
&
required
Fitted-amplitude cut & Forward:
& Not required
The forward kernel in space
For each detector position, the operational threshold is first converted to the corresponding single-image three-parameter threshold. For example, $\DETML=6$ corresponds to under the convention. The distribution is then computed in space; remains only the final operational threshold scale.
In the calibrated standalone emldetect case, the mean of
the forward kernel is
where is the empirical residual interpolated from the Section 5 calibration grid. Under the Gaussian residual approximation, the local kernel can be summarized as
The corresponding -th percentile curve is
where is the standard normal quantile. The percentile construction requires, besides the calibrated mean residual, the calibrated threshold-band dispersion model in space. Thus , , , .
In this proof-of-concept application we use the empirically corrected
dispersion model from Section 4 as the distribution backbone. The
Fisher-projected variance provides the analytic scale, but production
use of the full kernel or low-percentile maps requires direct validation
against standalone emldetect pass rates, since high-signal
reference fitter closure alone cannot validate the –10 threshold
band.
Application I: Interpreting traditional -selected catalogs
The first application retains the traditional catalog definition. Sources are selected by the observed detection statistic, e.g. >, equivalently . The new element is that the catalog threshold can now be interpreted through the forward kernel of Eq. ([eq:deltac-forward-kernel]).
For a source with measured , the fitted-amplitude posterior in catalog space is
where is the source-count prior expressed in fitted-amplitude coordinates. For a threshold-selected sample, a similar expression is
where
Under the Gaussian residual approximation, this exceedance probability is the normal survival function evaluated in space. This path does not replace the traditional threshold. Rather, it adds the likelihood layer needed to interpret the fitted-amplitude distribution of -selected catalogs. This is where Eddington bias enters: the noisy threshold statistic must be combined with a source-count prior, especially when the underlying is steep (Eddington 1913; Georgakakis et al. 2008; Wang 2004). Therefore the specified value or threshold itself does not define a flux distribution; it defines a likelihood factor in space. To obtain or , the likelihood must be combined with a source-count prior, e.g. a power-law slope or index expressed in fitted-amplitude coordinates. Because this is an inverse problem, it necessarily depends on the population prior. If the required prior is the intrinsic rather than the fitted catalog amplitude prior, an additional measurement model connecting to the fitted amplitude is needed.
Accordingly, the corresponding sky coverage is probabilistic rather than the step-function area from a single limiting amplitude. At a given pixel , a source with detected fitted amplitude has catalog-space density
within the normalization range in fitted-amplitude coordinates. Thus the traditional threshold catalog assigns probabilities to detected amplitudes at each pixel rather than a single deterministic limiting amplitude. The corresponding effective area at fitted amplitude is
where indexes sky or detector pixels. If the goal is the expected number of detected fitted amplitudes in interval , the same probability-weighted area combined with the source-count prior gives
This is why Application I’s sky coverage follows the detected fitted-amplitude probability distribution, whereas the percentile-cut construction below starts from the selected fitted-amplitude threshold-exceedance probability.
Application II: Fitted-amplitude percentile cuts
The second application uses the same kernel forward. Instead of asking which fitted amplitudes are contained in a noisy -selected sample, it asks what fitted amplitude is needed to exceed the detection threshold in a specified fraction of realizations. This map-construction step fixes and evaluates , so it does not require a slope or source-count index.
The usual sensitivity-map calculation is recovered as mean-curve crossing
Under the symmetric Gaussian residual approximation, this is also the 50th percentile threshold-exceedance point. We avoid calling it the empirical 50% completeness flux because injection-recovery completeness is usually defined as in injected-flux coordinates.
A more conservative fitted-amplitude cut is obtained by solving the threshold equation with a lower percentile curve,
where . Direction matters. Requiring 90% of realizations at a given fitted amplitude to exceed the threshold uses the lower 10th percentile, not the higher 90th percentile:
Likewise, under the Gaussian approximation, using the lower envelope corresponds to about a 97.7% threshold-exceedance criterion. Table [tab:threshold-crossing-terms] summarizes the terms used in this paper.
Sky coverage for fitted-amplitude threshold-crossing cuts
Applying the same exceedance rule to each detector pixel yields a family of fitted-amplitude sensitivity maps: the mean-threshold map, the 84% threshold-exceedance map from the lower 16th percentile, the 90% threshold-exceedance map from the lower 10th percentile, and so on. Each map can be converted to a threshold-exceedance sky-coverage curve by counting the sky area where the local limiting amplitude is below the trial fitted amplitude,
where indexes sky or detector pixels and denotes the percentile curve used in Eq. ([eq:percentile-threshold-crossing]). This threshold-exceedance sky-coverage calculation is an instrument/catalog-space quantity in the same fitted-amplitude coordinates used by the observable-conditioned theory: it depends on local background, PSF, mask, threshold and residual calibration, but does not require an assumed slope. A source-count model is needed only for subsequent population inference.
Relation between the two uses and Eddington bias
Both applications come from the same conditional distribution but answer different questions. Application I is backward: it infers the fitted-amplitude distribution from the observed value or -selected catalog. This is a natural setting for Eddington-bias modeling, since the asymmetry near the detection threshold is produced by the combination of the noisy threshold statistic and the steep source-count prior.
Application II is forward: it asks, from the fitted amplitude, for the probability of exceeding the threshold. This does not remove population-level Eddington bias from luminosity-function inference, but it does allow construction of an instrument catalog-space subsample with an explicitly stated threshold-exceedance probability. In this sense, the percentile sensitivity map is a catalog-construction tool, while the threshold-selected posterior is a catalog-interpretation tool.
Validation requirements and limitations
The Section 5 cross-validation validates the mean/median threshold fitted-amplitude mapping: at , the preferred bilinear interpolation reaches a maximum error of 11.0% within the calibration envelope, while the nearest-calibration-position fallback reaches 17.2
Thus the applications proposed here are a fast, distributed, catalog-oriented framework for threshold interpretation and fitted-amplitude threshold-exceedance sensitivity. Full injection-recovery simulation remains the absolute validation standard for production selection functions in complex survey fields.
The calibration grid, cross-validation tables, figure-generation scripts, configuration files and minimal scripts for reproducing the key validation results will be made available through a persistent Zenodo archive upon publication.
Scope and limitations
The proposed framework focuses on methodological progress: the conditional-mean formula, the Fisher-projected variance, and the observable-conditioning principle transfer algebraically to any Poisson PSF source-detection pipeline using a standard three-parameter fit; however, quantitative use requires pipeline-specific recalibration. Moreover, the quantitative calibration (specifically the position-dependent residual grid, leave-one cross-validation error budget and threshold-exceedance fitted-amplitude mapping) has been specifically validated using single-image false-source simulations in the XMM-Newton PN band-4 setup. Applying this method to different instruments, bands or detection pipelines will require re-deriving the pipeline-specific likelihood transform and fully recalibrating the implementation residuals with matched false-source grids.
Although the self-consistent reference fitter confirms the theoretical model structure in the high-signal region (), these results cannot be blindly extrapolated to the threshold band ($\DETML\approx 6$–10). At lower fitted signal (), the reference fitter exhibits a positive beyond-Fisher bias. The independent calibration absorbs this bias together with other algorithmic effects into the empirical residual, providing operational predictions for local and distributions.
Moreover, we emphasize that our empirical calibration is not a comprehensive correction to the official XMM-Newton source catalogs (e.g. 4XMM). Catalog environments involve complexities such as complex background map variations, multi-observation mosaicking, vignetting weighting and source confusion effects, which are not fully captured in our single-image standalone simulations. Other current X-ray catalog pipelines handle related complexities by substantially different mechanisms, e.g. the eROSITA eSASS/eFEDS simulation-calibration detection chain (Brunner et al. 2022; Liu et al. 2022) and the Chandra Source Catalog Release 2 series with merged observations, local PSF modeling and Bayesian aperture photometry (Evans et al. 2024). These examples reinforce that the residual calibration developed here is pipeline-specific.
Regarding spatial interpolation, bilinear interpolation within the calibration envelope gives minimum error, while nearest-calibration-position assignment gives a validated full-position fallback. The adopted sector coordinates are calibration coordinates, not physical detector azimuths. Calibration retains a weak background dependence; transferring the calibration to the background level introduces up to 5.7% error in inferring sensitivity limits, indicating that extrapolation to substantially different backgrounds without recalibration should be avoided.
If no calibration grid is available, the uncalibrated theory can serve as an approximate estimate, with a maximum error of 19.9% at . This is a fallback, not a recommended calibration method. If the target setup differs from the validated domain, the calibration should be regarded as unvalidated. Examples include: MOS instruments; merged images or multi-sample fits; fixed-position fits with different degrees of freedom; backgrounds outside the tested range –; PSF or mask conventions not matching the calibration grid; or official 4XMM catalog products.
Finally, Section 6 distinguishes two uses of the same forward kernel. The backward interpretation of traditional -selected catalogs is a population-inference problem requiring a source-count prior. The forward fitted-amplitude percentile map does not require such a prior at the map-construction stage, but source-count and Eddington-bias corrections still require an assumed or fitted source flux distribution, and where needed a measurement model connecting intrinsic flux to fitted flux.
Conclusions
The conditional mean improvement of the Cash statistic at the fitted source,
Under the SAS single-image convention (, ; $\DETML=-\ln Q(1.5,\,\Delta C/2)$, so $\DETML=6,\,8,\,10$ correspond to ), the standard three-parameter (one amplitude, two position) single-source PSF fit is derived in closed form. This mean itself is a generalization of existing analytic sensitivity-map work (Huang et al. 2025; Rosen et al. 2016; Stewart 2009; Traulsen et al. 2019), generalized in conditioning on the fitted amplitude rather than the model amplitude and explicitly carrying the fit mask. The essential difference of this framework from that line of work lies in the other two items: adding the Fisher-projected variance for the three fitted parameters, thereby giving the conditional dispersion of rather than only the conditional mean; and treating threshold selection as an exceedance event on a distribution rather than a single deterministic limit.
Self-consistent psfgen-template reference fitter simulations spanning
17 PN band-4 detector positions (about
fits) close the predicted mean to within
0.07
in the high-signal region
()
and close the Fisher-projected variance to within about 5%. The
threshold band $\DETML=6$–10 lies at
lower fitted signal (roughly
–
at
),
where the asymptotic low-signal bias and the implementation-dependent
residual of standalone SAS emldetect require an empirical
position-dependent residual calibration
.
The validated mean/50th-percentile exceedance equation
On the PN band-4 calibration grid at , it reproduces the reserved reference limiting amplitude with 11% accuracy (preferred bilinear interpolation, 10 of 14 hull positions retained) and 17% (nearest-calibration-position fallback, all 14 positions), with weak background dependence over – (maximum tested transfer error 5.7%). The adopted sector coordinates are calibration coordinates, not physical detector azimuths.
For catalog work, the calibration kernel can be used in both directions. Backward, it provides likelihood factors such as or for combining with a source-count prior to interpret traditional -selected catalogs. Forward, it gives the local fitted-amplitude threshold-exceedance probability $P(\DETML>T|S,x,b)$. For example, the 90% threshold-exceedance fitted-amplitude limit is the source amplitude whose predicted distribution has its 10th percentile equal to the detection threshold. The sky area as a function of fitted amplitude is then obtained by counting detector pixels satisfying the selected threshold-exceedance condition.
The methodological core is independent of XMM-Newton: the
observable-conditioned
theory for three-parameter Poisson PSF source fitting, and threshold
calibration in
residual space rather than the pipeline-reported detection-statistic
space. Extension to other Poisson PSF source-detection pipelines is a
natural follow-up; the above XMM-Newton emldetect result is
the first concrete validation and calibration application within this
framework.
Data and code availability
The calibration grid, cross-validation tables, figure-generation
scripts, SAS configuration files and minimal scripts for reproducing the
key validation results (including exact commands, random seeds, psfgen
parameters and emldetect invocation flags) have been
deposited in a Zenodo archive. Private review links are available; the
final DOI will be inserted upon acceptance.
The calibration grid is provided as machine-readable tables. Code is released under an open-source license.
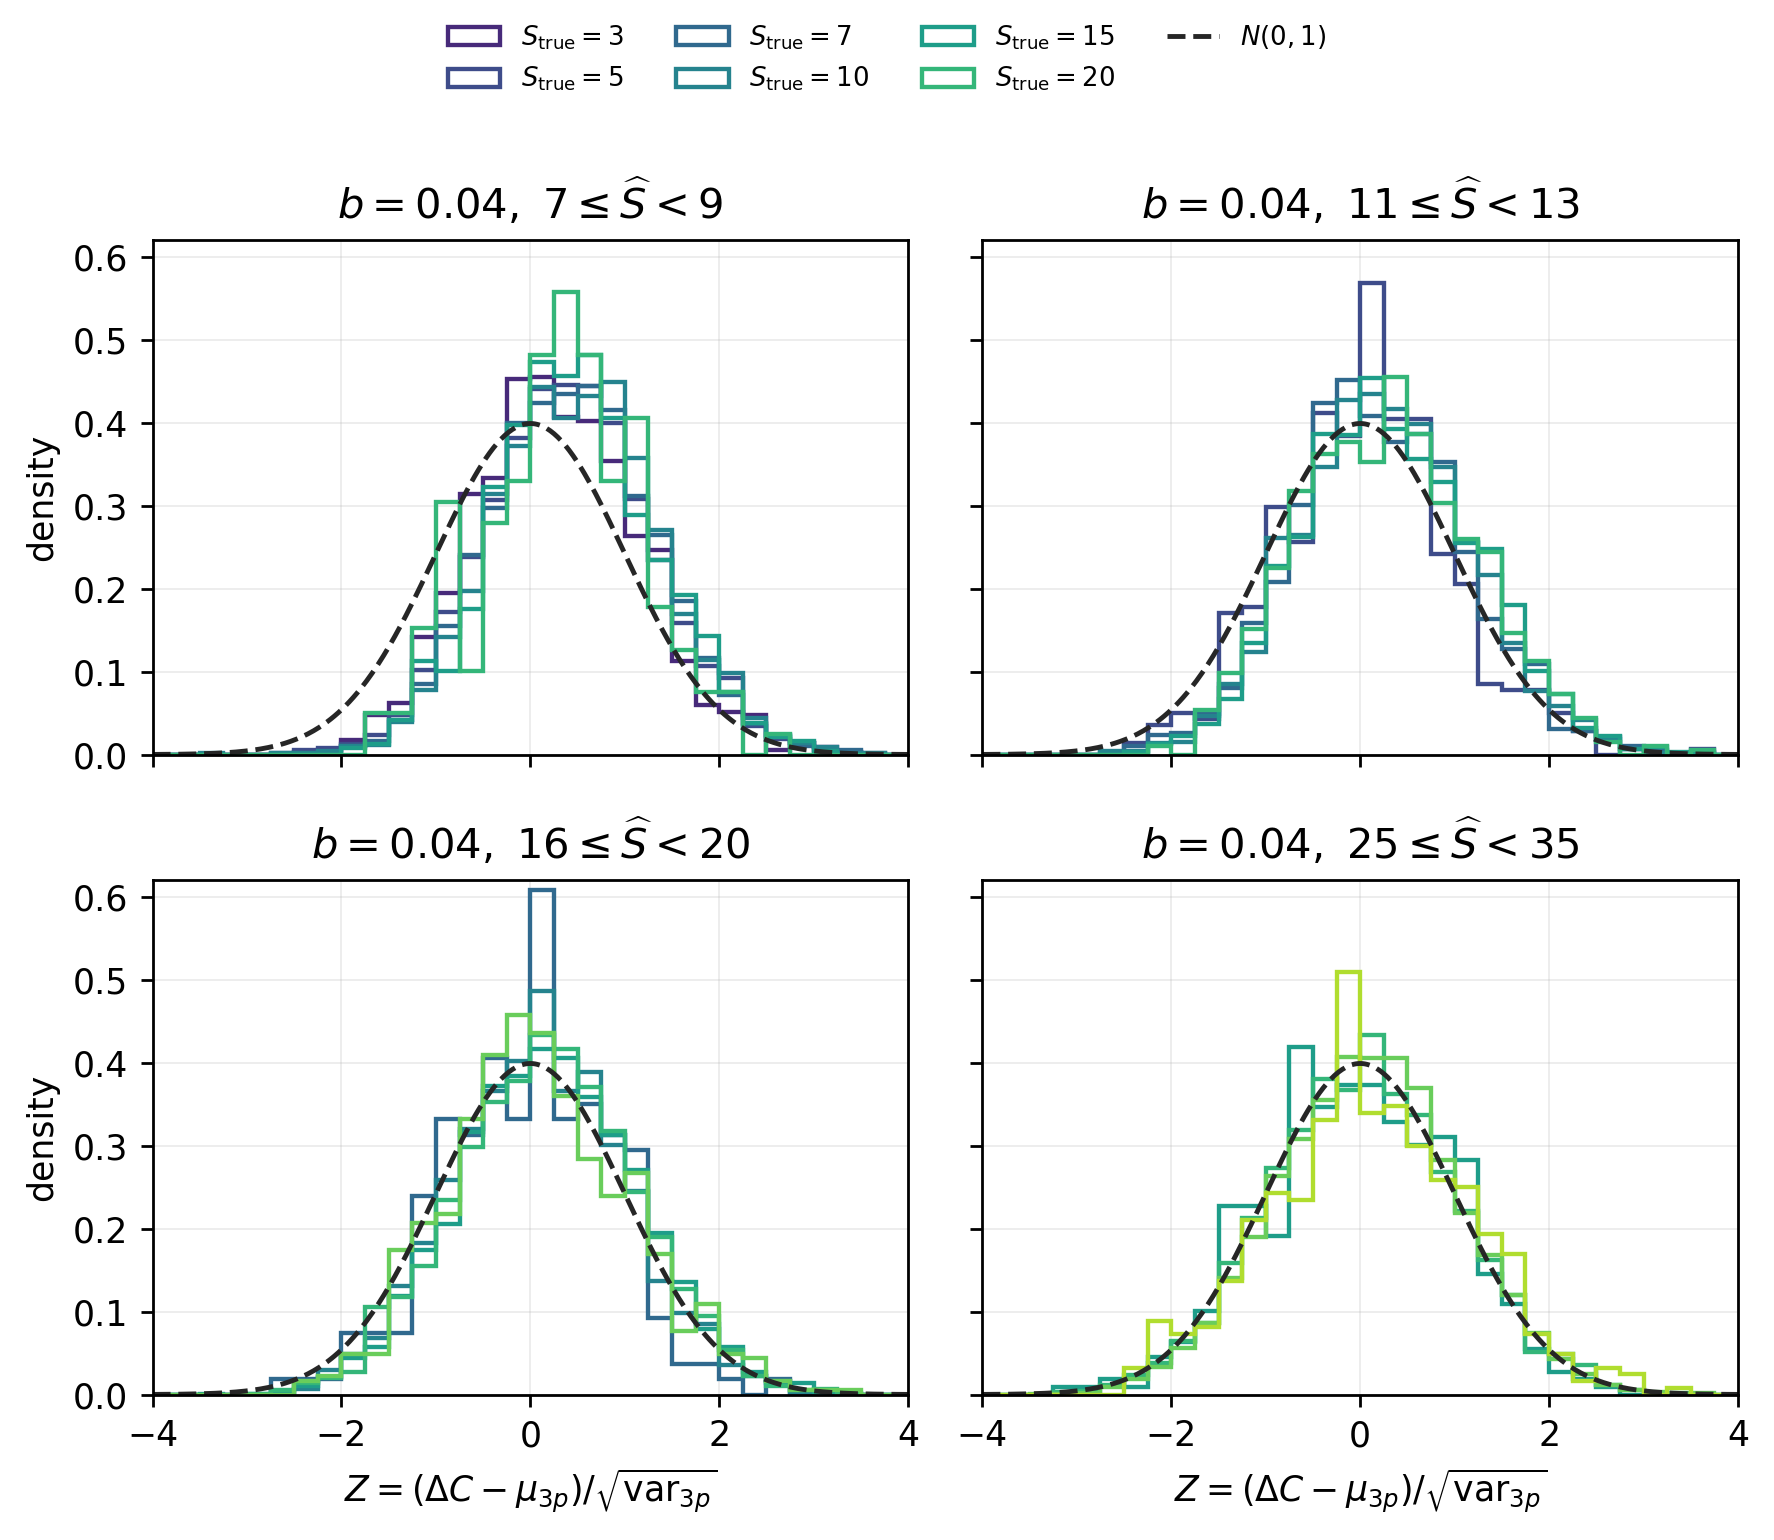
Diagnostic role of injected source strength
Figure 10 is a diagnostic check of the conditioning variable. The simulation knows the injected source strength , but the theory and operational calibration condition on the fitted amplitude . At fixed detected , the normalized residual distributions from different subsets overlap closely. The residual offset in the lowest bin is the same low-signal beyond-Fisher bias discussed in Section 4.2, not evidence for conditioning on .
Acknowledgments
We acknowledge support from the National Natural Science Foundation of China. This research used data obtained from the XMM-Newton satellite, an ESA science mission with instruments and contributions funded directly by ESA Member States and NASA.